Website Downtime Cost: How to Calculate It (Real Examples)
Most developers and site owners treat downtime like bad weather. It happens, you wait it out, everything goes back to normal. But downtime isn’t free. Every minute your site is unreachable, something is being lost. Revenue, trust, search rankings, or all three at once. The problem is that most people have never actually done the math.
Once you calculate what an hour of downtime really costs your business, the way you think about hosting, monitoring, and infrastructure changes completely. This article gives you the formula, a worked example, and two reference tables (one for translating uptime percentages into real downtime, one for estimating hourly cost by business type) so you can put a number on it in a few minutes.
Downtime Isn’t Just “Site’s Down”
When people say “downtime,” they usually picture a completely dead website. A blank screen, a 500 error, the whole thing offline. That’s the dramatic version. But partial outages are far more common and arguably more dangerous because they go unnoticed longer.
A checkout page that times out. An API endpoint returning errors to half your users. A login page that works in Europe but fails in the US because one CDN node went sideways. These are all forms of downtime, and they all cost money. The tricky part is that your visitors won’t always tell you. They’ll just leave.
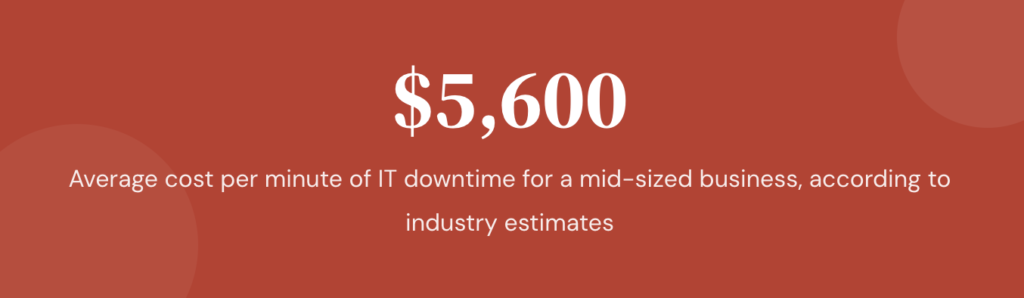
The enterprise numbers are sobering. In ITIC’s 2024 Hourly Cost of Downtime survey, 97% of large enterprises (1,000-plus employees) said a single hour of downtime costs them over $100,000, and 41% put the figure between $1 million and $5 million per hour. Those are big-company numbers, but the underlying point scales down: even if you’re running a small e-commerce store doing $300,000 a year, one hour of downtime during peak hours could cost you $200 to $500 in lost sales alone. That doesn’t include the support tickets, the refund requests, or the customers who never come back.
What “99.9% Uptime” Actually Means
Uptime percentages are easy to nod along to and hard to feel. A hosting plan promising “three nines” sounds rock solid until you convert that percentage into actual minutes your site is allowed to be down. Here’s the translation, measured as maximum downtime per year:
| Uptime SLA | Downtime per year | Downtime per month | Downtime per week |
|---|---|---|---|
| 99% (two nines) | 3d 15h 36m | 7h 18m | 1h 41m |
| 99.9% (three nines) | 8h 46m | 43m 50s | 10m 5s |
| 99.95% | 4h 23m | 21m 55s | 5m 2s |
| 99.99% (four nines) | 52m 35s | 4m 23s | 1m 1s |
| 99.999% (five nines) | 5m 15s | 26s | 6s |
The jump from 99.9% to 99.99% is the one most commercial sites care about: it’s the difference between losing the better part of a workday every year and losing under an hour. Each extra nine is roughly a 10x reduction in allowed downtime, and each one also tends to cost meaningfully more to deliver, so pick the target that matches what an hour of outage actually costs you (which is exactly what the next section calculates).
The Formula: How to Calculate Your Downtime Cost
There’s a straightforward way to estimate this. It won’t be perfect, because no formula captures every ripple effect, but it gives you a number you can actually work with.
Hourly downtime cost = (Annual revenue / 8,760) × percentage of revenue dependent on site availability × productivity impact multiplier
There are 8,760 hours in a year, so dividing annual revenue by that gives you revenue per hour. Scale it by how much of your business actually relies on the site being live, then apply a multiplier to capture the indirect costs (support load, SLA credits, team time) that pile on during an outage.
Let’s break that apart with a real example.
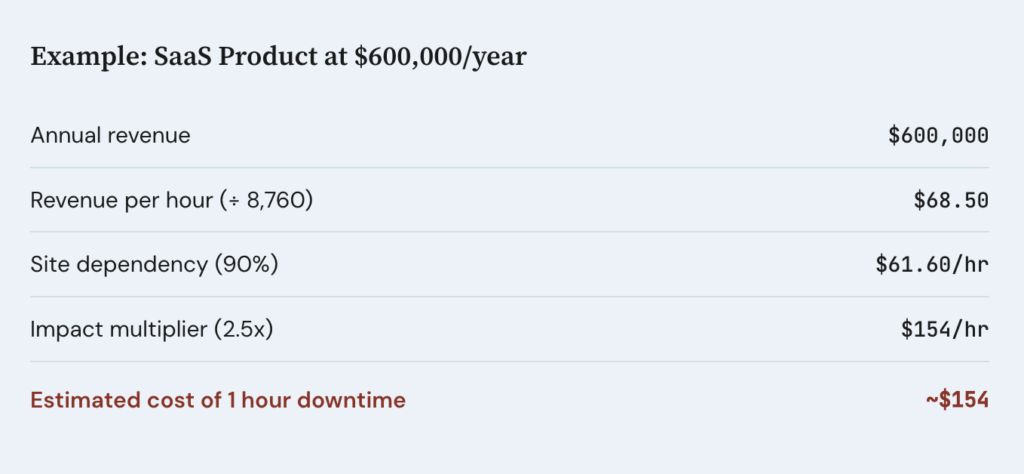
Say you run a SaaS product generating $600,000 per year. Total hours in a year: 8,760. That gives you roughly $68.50 in revenue per hour. If 90% of your revenue depends on the site being live (which is true for most SaaS), you’re looking at about $61.60 per hour of lost revenue during an outage.
That sounds manageable until you factor in the multiplier. Support costs spike. Your team drops what they’re doing to investigate. If you have an SLA with customers, you may owe credits. A reasonable multiplier for a SaaS company is 2x to 3x, which pushes the real cost to $120 to $185 per hour.
Estimated Hourly Downtime Cost by Business Type
The same formula produces very different numbers depending on how revenue-dependent your site is and how high the indirect costs run. Here are three common archetypes using the formula above, so you can find the row closest to your situation:
| Business type | Annual revenue | Revenue/hour | Availability dependence | Multiplier | Est. hourly downtime cost |
|---|---|---|---|---|---|
| Small e-commerce store | $300,000 | ~$34 | 95% | 3x (peak: higher) | ~$98/hr |
| Mid-size SaaS | $600,000 | ~$68 | 90% | 2x–3x | $120–$185/hr |
| Content / ad-supported site | $250,000 | ~$29 | 80% | 1.5x | ~$34/hr |
A few things to read out of this table. The e-commerce row uses a 3x multiplier because outages drag in refunds, support, and abandoned carts, and during a Black Friday peak that multiplier (and the underlying revenue-per-hour) climbs sharply. The content site sits lowest because its revenue is impression-based and partly recoverable later, with a thinner support tail. SaaS lands in the middle but carries the added risk of SLA credits and churn that a single bad outage can trigger. These are estimates, not quotes: plug your own revenue and honest multiplier into the formula rather than borrowing a row wholesale.
For an e-commerce site, the multiplier can be even higher during seasonal peaks. Black Friday downtime isn’t just lost sales. It’s lost sales at the highest-margin moment of the year, plus ad spend you’re burning while the site is unreachable.
The Costs You Don’t See on the Invoice
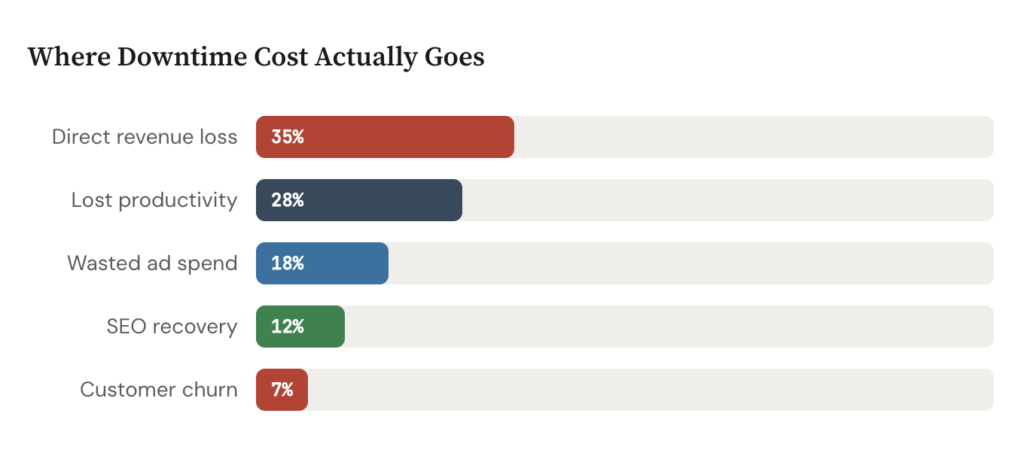
The direct revenue loss is the easy part. The indirect costs are where things get ugly.
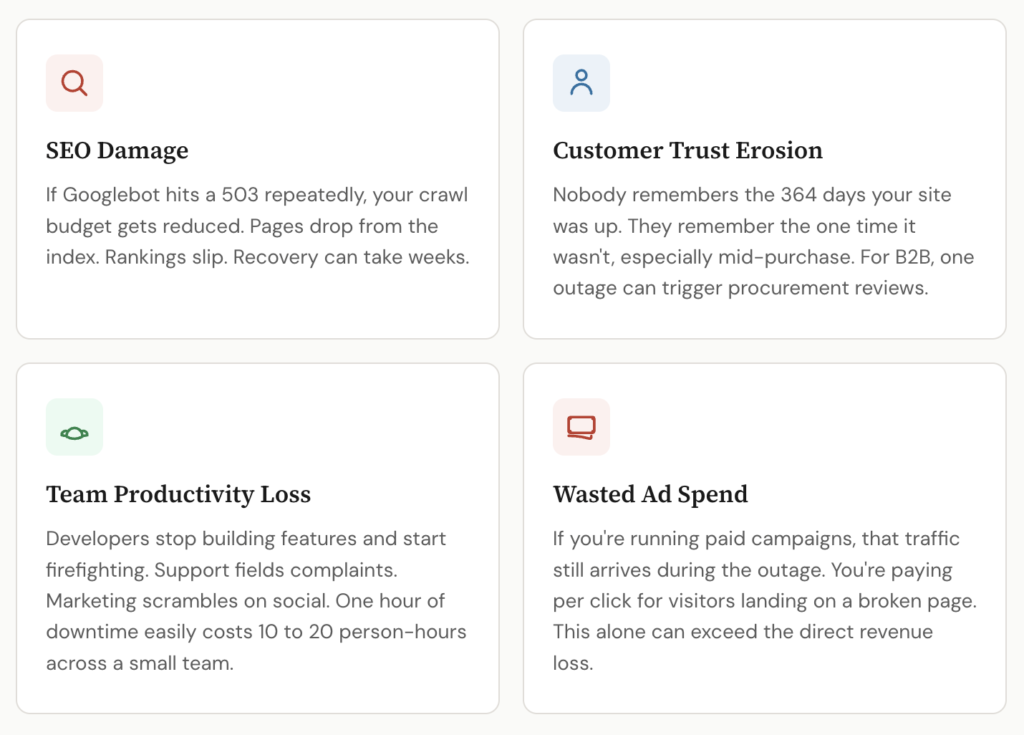
SEO damage. Google’s crawlers don’t wait around. If Googlebot hits your site and gets a 503 multiple times, your crawl budget gets reduced. Pages drop from the index. Rankings slip. It can take weeks to recover what a few hours of downtime cost you in organic visibility. If you’re in a competitive niche, your competitors just got a free boost.
Customer trust erosion. Nobody remembers the 364 days your site was up. They remember the one time it wasn’t, especially if it happened during a purchase, a signup, or a time-sensitive workflow. For B2B products, a single outage can trigger procurement reviews and push customers toward alternatives. A well-run status page won’t prevent the outage, but it does a lot to preserve trust by keeping people informed while you fix things.
Team productivity. When the site goes down, your developers aren’t building features. They’re firefighting. Your support team is fielding complaints instead of doing proactive work. Your marketing team is scrambling to update social channels. An hour of downtime can easily cost 10 to 20 person-hours across a small team.
Ad spend waste. If you’re running paid campaigns (Google Ads, Facebook, programmatic), that traffic is still arriving during the outage. You’re paying per click for visitors who land on a broken page. Depending on your daily ad budget, this alone can exceed the direct revenue loss.
Why Most Teams Underestimate Downtime
There’s a psychological thing that happens with reliability. When your site has been up for three months straight, it feels invincible. You stop thinking about monitoring. You skip the load testing before a launch. You let the SSL certificate auto-renew and assume it’ll work (it usually does, until the one time it doesn’t). Outages have more causes than most people expect. It’s worth understanding why websites go down so you know what you’re actually defending against.
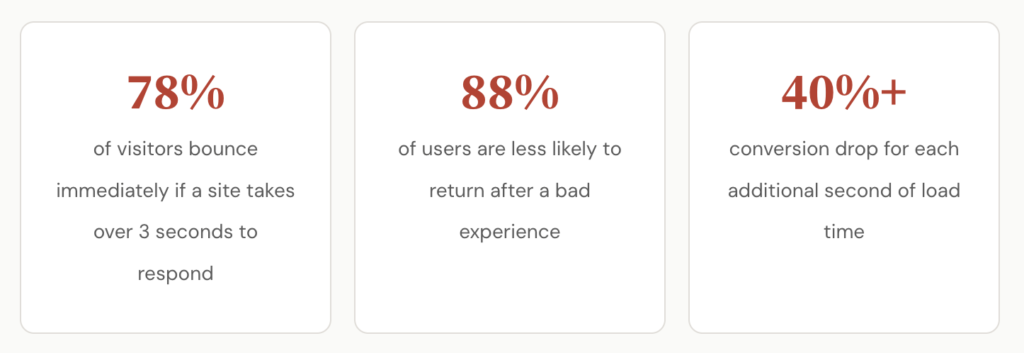
The other issue is that many teams only count total outages. If the site was technically “up” but responding in 14 seconds instead of 2, that doesn’t show up as downtime in a basic ping check. But your conversion rate during those slow periods probably dropped by 40% or more. Research from Google has consistently shown that each additional second of load time increases bounce rates significantly.
This is where proper monitoring makes the difference. A basic “is it up or down” check is better than nothing, but it won’t catch degraded performance, regional failures, or broken individual endpoints. If you’re serious about understanding your real uptime, you need a tool that checks frequently, from multiple locations, and alerts you before your customers notice. I put together a comparison of the best website monitoring tools that covers check intervals, pricing, status page features, and some fine print you’ll want to read before committing to a tool. It’s worth looking at if you haven’t evaluated this space recently, because the options and pricing models have changed a lot.
A Practical Downtime Budget
Here’s a concept that most small teams skip but shouldn’t: set an actual downtime budget.
If your site generates $50,000 per month and 85% of that depends on availability, you can estimate that one hour of downtime costs roughly $80 to $120 when you include indirect effects. That means 10 hours of downtime per year (which, per the table above, is roughly what a 99.9% SLA permits) would cost you somewhere between $800 and $1,200.
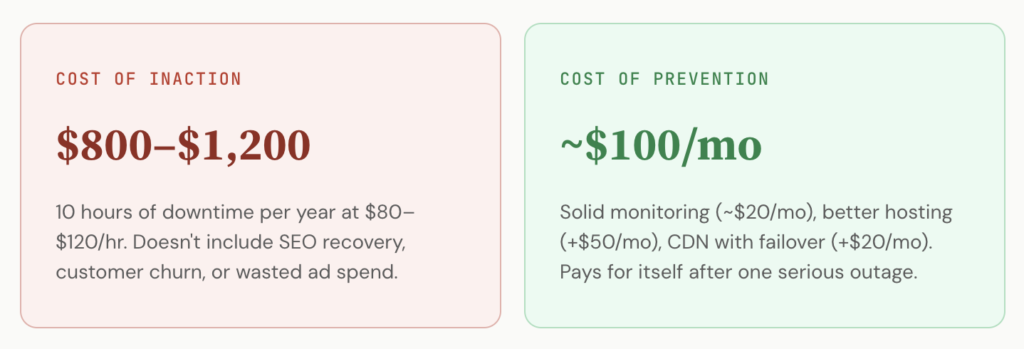
Now compare that to the cost of preventing it. A solid monitoring service like Pulsetic runs around $9 to $19 per month for most small to mid-sized setups. Better hosting might cost $30 to $50 more per month than the bargain plan you’re on. A CDN with failover adds another $20. You’re looking at maybe $100/month in reliability infrastructure, or $1,200/year, to prevent losses that could easily be multiples of that.
The math almost always works out in favor of prevention, which makes it strange how many teams still treat monitoring as an afterthought. It’s one of those things that feels optional until the first real outage, and then suddenly it’s the most obvious investment you should have made six months ago.
What to Actually Track
If you’re going to take downtime costs seriously, you need to know what to measure. Not everything needs a complex dashboard, but a few numbers go a long way.
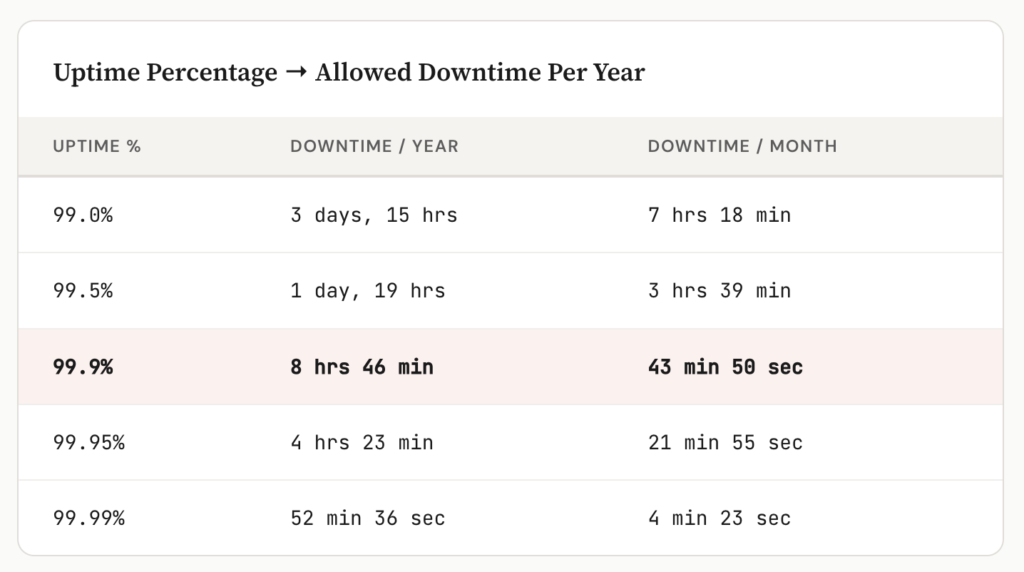
Uptime percentage. The classic metric. 99.9% uptime sounds great until you realize that still allows for nearly 9 hours of downtime per year (see the nines table above). For most commercial sites, you want to target 99.95% or higher.
Mean time to detection (MTTD). How long does it take you to find out something is wrong? If the answer is “when a customer emails us,” you have a problem. Good monitoring tools can get this down to under a minute.
Mean time to recovery (MTTR). Once you know about the issue, how fast can you fix it? This depends on your team, your infrastructure, and whether you’ve documented your incident response process. Most teams haven’t, which is why the same 20-minute fix turns into a 2-hour scramble at 2 AM.
Revenue per hour of uptime. This is the number from the formula above. Keep it updated as your business grows. A cost that started at $60/hour can quietly climb to $200/hour as revenue and traffic scale.
Making the Case Internally
If you’re a developer trying to convince your manager or a freelancer trying to explain this to a client, the formula above is your best friend. Vague warnings about “the site might go down” don’t move budgets. A specific number does.
“Our site earns roughly $140 per hour. Last quarter we had 6 hours of unplanned downtime. That’s $840 in direct losses, probably $2,000+ when you factor in SEO impact and wasted ad spend. A monitoring and alerting setup would cost us $240 per year.”
That’s a conversation most decision-makers can follow. You’re not asking for a blank check. You’re showing the gap between the cost of the problem and the cost of the solution.
FAQ
How much does an hour of website downtime cost?
It depends on your revenue, but the range is wide. In ITIC’s 2024 survey, 97% of large enterprises said an hour of downtime costs them over $100,000, and 41% put it between $1 million and $5 million per hour. For a small e-commerce store doing around $300,000 a year, an hour of downtime during peak traffic can mean roughly $200 to $500 in lost sales alone, before you add support load, refunds, wasted ad spend, and customers who never return. Use the formula in this article to estimate your own number.
How do you calculate website downtime cost?
Use this formula: hourly downtime cost = (annual revenue / 8,760) × percentage of revenue dependent on site availability × productivity impact multiplier. There are 8,760 hours in a year, so divide your annual revenue by that to get revenue per hour, scale it by how much of your business relies on the site being live, then apply a multiplier (commonly 2x to 3x) to account for indirect costs like support, SLA credits, and team time. A $600,000/year SaaS at 90% dependence and a 2x to 3x multiplier works out to roughly $120 to $185 per hour.
What is a good uptime percentage?
For most commercial sites, target 99.95% or higher. The popular 99.9% figure sounds reassuring, but it still allows nearly 9 hours of downtime per year (8h 46m, to be exact). Bump it to 99.99% and your annual allowance drops to about 52 minutes. Each extra “nine” is roughly a 10x reduction in downtime, so match the target to what an hour of outage actually costs you.
How much downtime does 99.9% uptime allow?
A 99.9% (“three nines”) SLA permits about 8 hours 46 minutes of downtime per year, which works out to roughly 44 minutes per month or 10 minutes per week. Moving to 99.99% cuts that to about 52 minutes per year, and 99.999% (“five nines”) allows only about 5 minutes per year. The nines table in this article lists the per-year, per-month, and per-week figures side by side.
Is monitoring worth the cost?
Almost always. Reliability infrastructure (a monitoring service, better hosting, and a CDN with failover) typically runs around $100/month, or about $1,200/year. That’s usually a fraction of what even a handful of hours of downtime costs once you include lost revenue, SEO damage, and wasted ad spend. See our roundup of UptimeRobot alternatives for tools at different price points.
Does website downtime hurt SEO?
Yes, if it’s frequent or prolonged. Short, occasional outages are usually shrugged off, but repeated 503s reduce your crawl budget, and extended downtime can cause Google to drop pages from the index and slip rankings that take weeks to recover. Returning a proper 503 status code (rather than a 200 on a broken page) and keeping outages short are the two things most within your control.
The Bottom Line
Downtime will happen. Hardware fails, code has bugs, DNS propagates slowly, and third-party services go offline without warning. You can’t prevent every outage, but you can dramatically reduce how often they occur, how long they last, and how much they cost you.
Start by running your own numbers through the formula. Even a rough estimate will probably surprise you. Then look at what you’re currently spending on reliability and ask whether it matches the risk. For most small teams and solo developers, there’s a meaningful gap between what downtime actually costs and what they’re doing to prevent it.
Close that gap, and you’re not just avoiding losses. You’re building the kind of site that users trust enough to come back to.
Build your Bootstrap theme
Design a custom Bootstrap 5 theme visually with a live preview, then export clean Sass or CSS.
Open the Builder