12 Best Website Monitoring Tools in 2026 (+ Open Source)
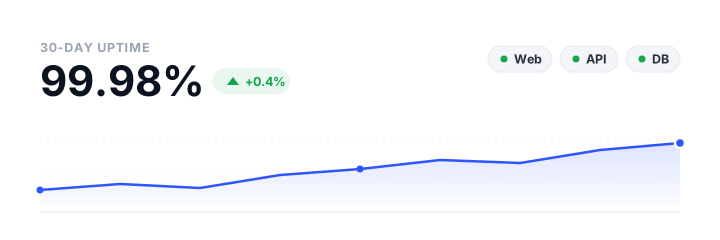
Downtime is one of those costs that stays invisible right up until it isn’t. A checkout that 500s for twenty minutes, an expired TLS certificate that scares off every visitor, a cron job that quietly stopped running three weeks ago: none of it shows up in your analytics, because analytics only measures the visitors who actually made it through. Website monitoring is the other half of that picture: the system that watches your site from the outside and tells you the moment something breaks, ideally before a customer does.
This guide ranks the best website monitoring tools for 2026, with real pricing, real check intervals, and honest limitations for each. It covers both hosted (SaaS) services and the leading open-source, self-hosted monitors, so you can choose between a managed product and software you run yourself. It’s aimed at web developers, agencies, and site owners who want to pick the right tool the first time rather than wade through a dozen affiliate listicles that all conveniently rank themselves at number one. We lead with Pulsetic because it’s the best fit for most people reading this (clean uptime monitoring with genuinely good status pages), but every other tool here earns its place for a specific kind of buyer, and we’ll tell you exactly which.
What website monitoring is
Website monitoring is the continuous, automated practice of checking that your site and the services behind it are reachable, fast, secure, and working correctly, from the outside, the way a real user would experience it. A monitor sends periodic requests from one or more locations, measures the response (status code, latency, page content, certificate validity), compares it against what it expects, and alerts you the moment something deviates.
That sounds simple, but “monitoring” covers several distinct jobs, and knowing which ones you actually need is the single biggest factor in choosing a tool. Most people pick a product before they understand the category.
The main types of monitoring
Here are the types you’ll encounter:
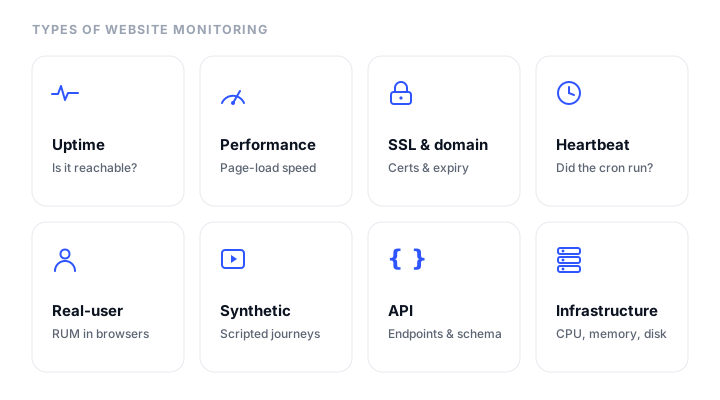
- Uptime / availability monitoring. The baseline “is it up?” check: ping a URL, host, or port from external locations and confirm a healthy response within a timeout. Often paired with keyword checks to catch soft failures where the page loads but shows an error. Every production site needs this.
- Performance / page-speed monitoring. Tracks how fast pages load and render (TTFB, full load time, and Core Web Vitals such as LCP, INP, CLS) over time, so regressions surface before they hurt rankings or conversion.
- SSL/TLS and domain-expiry monitoring. Watches certificate validity and domain registration so renewals never lapse silently. Critical for agencies juggling dozens of certs and domains, where one quiet expiry takes a client fully offline.
- Cron / heartbeat monitoring. Inverts the model: a scheduled job (backup, queue worker, ETL) pings the monitor on success, and you’re alerted if the expected check-in never arrives. The only way to catch a backup that stopped running three weeks ago.
- Real-user monitoring (RUM). A JavaScript snippet collects performance and error data from actual visitors’ browsers, segmented by device, geography, and connection. This is field data, the truth about how real people experience your site.
- Synthetic / transaction monitoring. Scripted browser robots replay multi-step journeys (log in, search, add to cart, checkout) on a schedule, asserting each step works. Catches broken funnels even when the homepage is up.
- API monitoring. Checks REST/GraphQL endpoints for correct status codes, response schema, auth, and latency, often chaining requests, not just confirming the endpoint responds.
- Infrastructure / server monitoring. Agent-based collection of CPU, memory, disk, and process health from inside the box, so you can see why an external check failed.
Most teams start with uptime plus SSL and grow into the rest. If you want the deeper case for any of this, our breakdown of what website downtime actually costs puts numbers on the stakes, and why websites go down covers the failure modes monitoring is meant to catch.
How we picked
We weighed each tool against the things that actually determine whether monitoring earns its keep, not the marketing feature count:
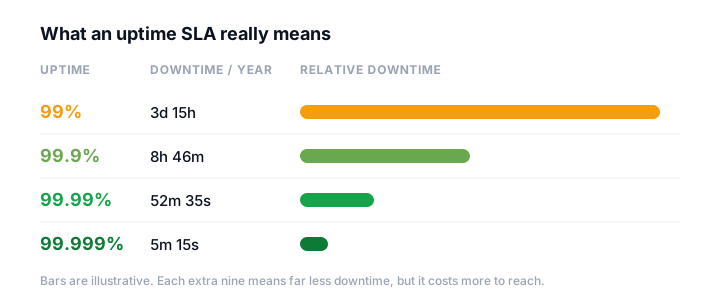
- Check frequency. A 5-minute interval means your site can be down for nearly five minutes before the first failed check even registers. Sub-minute checks shrink that blind spot. We note the fastest interval each tool offers and, crucially, which tier you need to reach it.
- Global check locations. A single vantage point can’t tell a real outage from a local network hiccup or a regional CDN problem. More geographically distributed checkpoints confirm failures (cutting false alarms) and reveal region-specific issues.
- Alert channels and escalation. An alert is only useful if it reaches the right person fast. We looked for multi-channel delivery (email, SMS, voice, push, Slack, Teams, PagerDuty/Opsgenie) and, where it exists, on-call scheduling and escalation.
- Status pages. A built-in, auto-updating status page cuts support load during an outage and preserves trust, and saves you from building one yourself.
- Pricing transparency. We modeled real cost and called out free-tier limits honestly, including when you’ll outgrow them. Every price and limit below comes from the vendor’s own pages or, where noted, third-party listings.
- Fit for the buyer. Solo devs, agencies, SaaS teams, and SRE shops want very different things. We mapped each tool to the buyer it actually serves.
One note before the list: Freshping, Freshworks’ free monitor, has been reported as discontinued, so it’s not a pick here even though older roundups still list it.
The best website monitoring tools at a glance
| Tool | Free tier | Starting paid price | Fastest check | Status pages | Best for |
|---|---|---|---|---|---|
| Pulsetic | 10 monitors, 5-min, 3 status pages | $9/mo (Solo) | 30s (Team+) | Yes, flagship: every tier incl. free | Teams/agencies wanting clean uptime + branded status pages |
| UptimeRobot | 50 monitors, 5-min (personal use only) | $7/mo annual (Solo) | 30s (Enterprise) | Yes, 1 free (branded) | Budget uptime with broad check types |
| Better Stack | 10 monitors + 10 heartbeats, 3-min | $29/mo annual (Responder seat) | 30s (paid) | Yes, 1 free | DevOps/SRE wanting uptime + on-call + observability |
| Pingdom | None (30-day trial) | ~$10/mo annual (Synthetic) | 1 min | Yes, ~1 per org | Established businesses wanting RUM + transaction in one suite |
| StatusCake | 10 monitors, 5-min | ~€16.66/mo annual (Superior) | 30s (Business) | Paid tiers only | All-in-one uptime, SSL, domain, server on a budget |
| Site24x7 | 5 monitors, 1-min, 1 status page | ~$9/mo annual (Web Uptime) | 30s (10s on top Enterprise) | Yes, 1 free | Full-stack: uptime through APM/infra/logs |
| Uptime | None (14-day trial) | $20/mo (Starter) | 30s (higher tiers) | Yes (extra pages add-on) | SRE/ops needing synthetic + API + RUM + SLA reporting |
| Checkly | 10 monitors, 2-min, 6 locations | $24/mo annual (Starter) | 30s (Team), 1s (Enterprise) | Yes, incl. free | Devs wanting monitoring-as-code with Playwright |
| Datadog Synthetics | No standing free tier (usage-billed) | $5 per 10K API runs | 1 min (API) | Separate product | Teams already on Datadog wanting correlated synthetics |
| Uptime Kuma | Self-hosted, free | Free (open source) | 20s | Yes | Homelabbers and small-to-mid teams wanting free, private uptime + status pages |
| Gatus | Self-hosted, free | Free (open source) | 60s default (configurable) | Yes | Developers wanting declarative, GitOps-style monitoring + status page |
| Prometheus + Blackbox Exporter | Self-hosted, free | Free (open source) | Set by Prometheus scrape (commonly 15s to 60s) | No (use Grafana) | Teams on a Prometheus stack wanting code-driven, unlimited probing |
Prices are billed-annual monthly equivalents unless noted. Pingdom figures are from third-party aggregators (see its section). Now the detail.
The best hosted monitoring tools, reviewed
1. Pulsetic: best overall for most teams
What it is. Pulsetic is a lightweight website uptime monitoring service built around clean, highly customizable hosted status pages and multi-channel downtime alerts. It does one job, external uptime monitoring with great incident communication, and does it well, without trying to also be a full observability platform.
Who it’s for. Small-to-midsize teams and agencies that want reliable uptime monitoring with beautiful, branded public status pages, without paying for heavyweight APM they’ll never use.
Key strengths. The status pages are the standout: polished, fully customizable (custom domains, logos, colors, fonts, multi-language), and available even on the free tier. Most competitors gate this behind a paid plan. The UI is modern and fast to set up. The free plan is unusually generous for a status-page-focused tool: 10 monitors plus 3 status pages at no cost. Paid tiers are flat-rate and affordable (Solo $9/mo, Team $19/mo, Organization $49/mo), with included SMS and voice-call credits on Team and above, and a wide alert spread: email, SMS, voice call, Slack, Teams, Discord, Telegram, plus Datadog, Zapier, and webhooks. Check intervals scale sensibly: 5 minutes free, 60 seconds on Solo, and 30 seconds on Team and Organization, across up to 15 global checkpoints.
The catch. Pulsetic is deliberately focused, and that means real gaps if you need more than uptime. There’s no real-user monitoring, no page-speed/Core Web Vitals tracking, and no multi-step synthetic/transaction monitoring, so it isn’t an APM or full observability tool. It also lacks native PagerDuty or Opsgenie integration (webhooks, SIGNL4, Datadog, and Zapier are partial workarounds), which matters if your on-call workflow runs through those. There’s no dedicated mobile app, and reaching 30-second checks means stepping up to the $19 Team plan. If your team needs synthetic transaction checks or RUM, pair Pulsetic with another tool or look further down this list.
Pricing. Free $0 (10 monitors, 5-min, 3 locations, 3 status pages); Solo $9/mo; Team $19/mo; Organization $49/mo. Annual billing gives two months free (Solo $90/yr, Team $190/yr, Organization $490/yr). Organization adds SSO, API/MCP access, 5-year history, and priority support; third-party listings suggest its monitor count can scale further at roughly $0.20 each, though that figure isn’t on the live pricing page.
If you’re specifically leaving UptimeRobot, we go deeper on the migration in our focused guide to UptimeRobot alternatives.
2. UptimeRobot: best generous free tier on a budget
What it is. UptimeRobot is the popular, affordable cloud monitor that checks uptime, response time, SSL, ports, and more, alerting across many channels. With 3M+ users it’s one of the most mature, stable products in the category.
Who it’s for. Individuals, developers, and small-to-mid businesses wanting cheap, easy uptime and basic infrastructure monitoring with public status pages.
Key strengths. The free tier is famously generous (50 monitors, more than most rivals offer at any price) and entry pricing is low overall. Coverage is broad for a budget tool: HTTP, keyword, ping, port, SSL and domain expiry, cron/heartbeat, DNS change detection, and response-time tracking in one place. There’s a wide range of alert channels and 20+ integrations, plus a well-known mobile app.
The catch. Two things to read carefully. First, the free plan checks at a fixed 5-minute interval and, since December 2024, is restricted to personal, non-commercial use. Second, the upgrade path is awkward: key integrations like Slack, webhooks, and PagerDuty require the paid Team plan, SMS and voice are paid credits on top of any plan, and the cheapest Solo tier caps you at ~10 monitors, fewer than the free tier’s 50. Monitoring is region-based (4 regions: NA, EU, Asia, Australia) rather than dozens of named city checkpoints, and there’s no deep synthetic or RUM.
Pricing. Free $0 (50 monitors, 5-min, personal use); Solo $8/mo or $7/mo annual ($84/yr); Team $34/mo or $29/mo annual ($348/yr); Enterprise $64/mo or $54/mo annual ($648/yr). 30-second checks require Enterprise.
3. Better Stack: best all-in-one for DevOps and SRE
What it is. Better Stack (formerly Better Uptime) is a modern, modular platform that combines uptime monitoring, incident management with on-call scheduling, hosted status pages, and a full telemetry suite: logs, metrics, traces, error tracking, and RUM with session replay.
Who it’s for. Developer, DevOps, and SRE teams that want a single modern platform unifying uptime, incident response, status pages, and observability, especially startups that can exploit the strong free tier.
Key strengths. The free tier is unusually generous: 10 monitors plus 10 heartbeats, a status page, Slack and email alerts, and telemetry allowances (around 5,000 session replays/month). It’s a true all-in-one stack with tightly linked context (a session replay ties back to its errors, traces, and logs) which is genuinely hard to get elsewhere without stitching tools together. Paid Responder seats include unlimited phone-call and SMS alerts plus native on-call scheduling and escalations, and the modular pricing lets you pay only for the products and capacity you use. It’s positioned as far cheaper than Datadog.
The catch. That modularity is also the friction. The per-seat-plus-add-on model makes your monthly bill hard to estimate up front (capacity add-ons run roughly +$25/mo per 50 extra monitors). The free tier and free monitoring are capped at 3-minute checks; 30 seconds needs a paid plan. The breadth brings a learning curve, and it’s less mature than specialists like Uptime in deep synthetic/transaction monitoring. Better Stack also doesn’t publish an exact number of global checkpoints.
Pricing. Free $0; paid Responder (uptime/incident) seats $34/mo monthly or $29/mo annual; telemetry-only Team Member seats $0; telemetry bundles roughly $25 to $30/mo up to ~$1,750/mo. 60-day money-back guarantee.
4. Pingdom: best mature suite with RUM and transactions
What it is. Pingdom, now a SolarWinds product, is a long-established SaaS monitor that blends synthetic uptime and transaction checks with real-user monitoring and page-speed/waterfall analysis from a large global probe network.
Who it’s for. Established businesses that want a mature, all-in-one commercial suite combining synthetic uptime, transaction checks, RUM, and page speed under a recognizable vendor with enterprise support.
Key strengths. Fifteen-plus years of operation, a 100+ location global probe network, and a feature set that spans synthetic uptime, multi-step transaction monitoring (login, checkout), waterfall page-speed analysis, and RUM in one platform. Incident-routing integrations are strong (Slack, PagerDuty, Opsgenie, Splunk On-Call) and the SolarWinds backing appeals to organizations that want a commercial vendor with enterprise support.
The catch. There’s no free tier, only a 30-day trial, and pricing runs high versus modern rivals. The native iOS/Android apps were discontinued in 2021, and there’s no native voice-call alerting, so on-call engineers lean on SMS, email, and integrations, and SMS is a paid, non-refilling credit add-on. Reviews note an aging UI, roughly one status page per org, and Synthetic and RUM being billed as two separate product lines.
Pricing (third-party). Pingdom’s own pages returned errors to automated checks this session, so these come from recent aggregators and should be treated as approximate. Synthetic Monitoring: Starter ~$15/mo (~$10/mo annual), Standard ~$50/mo, Advanced ~$95/mo, Professional ~$249/mo. RUM from ~$10/mo (~$8/mo annual) for 100K pageviews. Fastest interval is 1 minute.
5. StatusCake: best budget all-rounder
What it is. StatusCake is a UK-based monitor covering uptime, page speed, SSL/TLS and domain expiry, DNS changes, and Linux server health from checkpoints across 30+ countries.
Who it’s for. Small businesses, agencies, and developers wanting affordable all-in-one uptime, SSL, domain, and server monitoring with a usable free tier.
Key strengths. A genuinely usable free tier (10 monitors) and broad protocol coverage (HTTP, HEAD, TCP, DNS, SMTP, SSH, PING, and PUSH heartbeats) alongside SSL, domain, page-speed, and Linux server monitoring in one tool. Confirmation servers help cut false-positive noise, and the alert/integration list is wide, including SMS, voice calls, PagerDuty, Opsgenie, and Datadog.
The catch. No RUM and no multi-step synthetic/transaction monitoring. Several reviews call the UI dated and occasionally unintuitive. The pricing jump is steep: you go from Free (10 monitors) straight to ~€20/mo (100 monitors) with no cheap middle tier, and public status pages plus 30-second checks are gated to higher paid plans, with limited status-page customization lower down.
Pricing. The live site quotes EUR: Free €0; Superior €19.99/mo monthly or €16.66/mo annual; Business (most popular) €69.99/mo monthly or €58.33/mo annual; Enterprise custom. USD review pages cite roughly $24.49 (Superior) and $79.99 (Business). 30-second checks require Business.
6. Site24x7: best for full-stack coverage
What it is. Site24x7, a ManageEngine/Zoho product, is an all-in-one observability platform spanning website uptime, infrastructure, APM, logs, network, RUM, synthetic monitoring, and even cloud cost.
Who it’s for. Teams and MSPs wanting one affordable platform that reaches from website uptime all the way through full infrastructure and APM observability, rather than a single-purpose uptime checker.
Key strengths. Extraordinary single-platform breadth at a low entry price, with 130+ global monitoring locations plus private/on-prem location support. You get a lot of monitor types even at low tiers, with 30-second checks available and 10-second polling on top Enterprise plans. Hosted status pages come bundled via StatusIQ, and ITSM/ChatOps integrations (PagerDuty, Opsgenie, ServiceNow, Jira, Slack, Teams) are strong.
The catch. The credit/à-la-carte pricing model and many overlapping product-line plans make the true monthly bill hard to predict. The breadth brings a busier UI and steeper learning curve than focused uptime tools. The Free Forever plan is limited to 5 monitors at 1-minute checks with advanced types gated to paid, and the fastest 10-second polling is reserved for the priciest Enterprise tiers.
Pricing. Free Forever (5 monitors, 1-min, 1 status page; a trial-activation promo can grant up to 50 resources free). Website Monitoring: Web Uptime ~$9/mo annual (25 sites, 1-min, 32 locations); Web Perf ~$36/mo annual; Enterprise Plus Web ~$899/mo annual (30-sec polling). Infrastructure plans start ~$9/mo annual (Lite). Roughly 10% off when billed annually.
7. Uptime: best for SLA reporting and breadth
What it is. Uptime is an enterprise-grade platform combining uptime/availability checks, synthetic transaction and API monitoring, RUM, and polished public and private status pages from a large global probe network.
Who it’s for. Engineering, SRE, and operations teams at growing businesses and enterprises that need broad, all-in-one monitoring (synthetic, API, RUM, plus uptime) with strong status pages and SLA reporting.
Key strengths. Very broad coverage in one platform (uptime, transaction/synthetic, API, page speed, RUM, SSL/domain, heartbeat, and private-location checks) backed by a large probe network (the site cites 100+ probe servers / 80+ points of presence) with multi-location checks and 30-second intervals on higher tiers. The status-page offering is strong (public and private/SSO, custom domains, subscriber notifications), and it leans enterprise with SLA reporting, maintenance windows, and a focus on minimizing false positives.
The catch. No free tier, just a 14-day trial, and a relatively high $20/mo entry price versus budget rivals. The modular add-on model (separate RUM, status-page, and probe-location modules) makes total cost harder to predict and adds up. The pricing page is calculator-driven and opaque: only the Starter tier’s specs were directly verifiable, and that entry plan is capped at a slow 10-minute check interval with few locations and one user, so faster checks and scale require notably pricier tiers.
Pricing. No permanent free plan; 14-day trial, 30-day money-back guarantee. Starter $20/mo (20 basic checks, 1 transaction, 1 API, 1 user, 4 locations, 10-min minimum). Add-ons stack on a base plan: RUM from ~$5/mo, extra status pages from ~$19/mo, extra probe locations from ~$1/mo. Higher tiers (Premium ~$60/mo per third-party listings) and Enterprise are quote-based; ~20% off annually.
8. Checkly: best monitoring-as-code
What it is. Checkly is a developer-first, monitoring-as-code platform that runs synthetic API and Playwright browser checks plus uptime, SSL, TCP, DNS, and heartbeat monitors from global locations, with code-defined config and CI/CD workflows.
Who it’s for. Developer and SRE/DevOps teams that want code-defined synthetic API and browser monitoring wired into CI/CD and GitOps pipelines.
Key strengths. Best-in-class monitoring-as-code with real Playwright browser scripting, defined in your repo and deployed through a CLI, ideal for teams that treat monitors like any other code. Very fast intervals are available (down to 1 second on Enterprise), the free Hobby tier is generous, and the synthetic/transaction testing is excellent alongside broad uptime types. Integrations lean developer/observability: Terraform, Pulumi, Datadog, Grafana, Honeycomb, PagerDuty, Opsgenie.
The catch. No true RUM, it’s synthetic-only. The code-centric approach has a real learning curve and isn’t for no-code users. Usage-based overages and tier-gated locations/intervals can feel rigid (free and Starter plans are limited to 6 of the 22+ locations), and there’s no built-in visual regression.
Pricing. Hobby $0 (10 monitors, 10K API checks/mo, 1K browser checks/mo, 2-min minimum, 6 locations). Starter $24/mo (1-min); Team $64/mo (30-sec, all 22 locations); Enterprise custom (1-sec). Prices are annual rates; usage overages apply (e.g., ~$4 per 1,000 extra browser runs).
9. Datadog Synthetic Monitoring: best if you already run Datadog
What it is. Datadog Synthetic Monitoring is an enterprise module inside the Datadog observability platform that runs API and browser-based synthetic tests from managed global and private locations, correlated directly with APM traces, RUM, logs, and infrastructure metrics.
Who it’s for. Engineering and SRE teams already on (or moving to) Datadog who want synthetic and transaction testing tied into full-stack observability and CI/CD pipelines.
Key strengths. The deep platform integration is the whole point: a failing synthetic test links straight to backend root cause across one observability pane. Test types are sophisticated: multistep API chains, full browser/transaction recordings with self-maintaining locators, mobile app testing, and network-layer tests (DNS, TCP, UDP, ICMP, gRPC, WebSocket, SSL). CI/CD shift-left testing is strong (GitHub, GitLab, Jenkins, CircleCI), and you can deploy unlimited self-hosted private locations for internal apps, with enterprise-grade RBAC and correlation.
The catch. Pure usage-based per-run pricing is hard to predict and gets expensive fast: running one test across all locations at 1-minute intervals can generate millions of billed runs a month, and browser and mobile runs are costly. It’s overkill and pricey for teams that only need simple uptime/SSL/heartbeat checks. Hosted public status pages aren’t included (they’re a separate Incident Response product), and you’re committing to the broader Datadog ecosystem and its billing complexity.
Pricing. No standing free tier for Synthetics (14-day platform trial; usage-billed after). List prices: API tests $5 per 10,000 runs/mo annual; browser tests $12 per 1,000 runs/mo annual; mobile app testing $50 per 100 runs/mo annual. Annual commitment saves roughly 17 to 20% over month-to-month. API tests run at a 1-minute minimum; browser tests default to 5 minutes (1-minute on request).
Best open-source, self-hosted monitors
Self-hosting makes sense when you want full control over your monitoring data and no per-monitor or per-seat fees: the software is free, you can scale to as many checks as your hardware allows, and everything stays on your own infrastructure. The trade-off is that you run and maintain it yourself, including updates, backups, and uptime of the monitor itself, and there is no built-in global probe network, so by default you check from wherever you deploy. These three are the leading open-source options, in rough order of how easy they are to stand up.
10. Uptime Kuma: best self-hosted all-rounder
What it is. Uptime Kuma is a fancy, free, self-hosted monitoring tool for tracking the uptime of websites, services, APIs, ports, and more, with a real-time dashboard, public status pages, and 90+ notification integrations. It is the most popular open-source uptime monitor by a wide margin (around 88.6k GitHub stars).
Who it’s for. Homelabbers, self-hosters, and small-to-mid teams who want free, privacy-respecting uptime monitoring and status pages without paying for SaaS.
Key strengths. Completely free and open-source with no per-monitor or per-seat fees, unlike paid SaaS such as Pingdom or UptimeRobot. Monitor coverage is very broad: HTTP(s), keyword matching, JSON-query response parsing, TCP port, ping/ICMP, DNS records, WebSocket, push/heartbeat, Steam game servers, Docker containers, plus TLS/SSL certificate and domain-expiry tracking, with worldwide Globalping probes added in v2.1. Notifications span 90+ services (email, Slack, Discord, Telegram, Teams, PagerDuty, Opsgenie, Gotify, Matrix, ntfy, and many more), the real-time UI is polished, and built-in public/private status pages support custom domains, uptime history, ping charts, certificate info, and incidents. It is actively maintained with a large community and a short 20-second minimum check interval.
The catch. A single self-hosted instance monitors from one location, so it can give false positives during your own network or host outages, and there is no managed multi-region global probe network by default (the Globalping integration only partially mitigates this). If the server running Uptime Kuma goes down, your monitoring and alerts go down with it unless you run it off-site or pair it with an external watchdog, and responsibility for updates, backups (SQLite), uptime, and TLS falls on you. It also lacks some enterprise SaaS features such as deep SLA reporting, large-scale multi-tenant management, and turnkey on-call scheduling (it relies on external tools like PagerDuty or Opsgenie for escalation).
License and self-hosting. MIT licensed, written in JavaScript (Vue.js frontend, Node.js backend). Self-hosted only, and easiest via Docker (docker run -d -p 3001:3001 -v uptime-kuma:/app/data louislam/uptime-kuma:2) or Docker Compose. You can also install bare-metal via Node.js 20.4+ with Git and PM2 (npm run setup then pm2 start server/server.js). Community Helm charts, Kubernetes manifests, and one-click PaaS templates exist but are not first-party. It is lightweight, running comfortably on a small VPS or Raspberry Pi (a few hundred MB of RAM), is SQLite-backed by default, and takes little setup effort. The latest stable release is v2.4.0 (around May 2026).
11. Gatus: best for declarative, config-as-code monitoring
What it is. Gatus is an open-source, developer-oriented health dashboard and status page that runs YAML-defined health checks against your endpoints, alerts you before clients are impacted, and supports incidents and announcements. The entire setup lives in one declarative config file, which makes it a natural fit for GitOps workflows.
Who it’s for. Developers and self-hosters who want a free, declarative, GitOps-style uptime monitor plus status page they fully control.
Key strengths. It is a single lightweight Go binary with a tiny resource footprint (commonly around 40MB of RAM for dozens of endpoints), far cheaper than paid SaaS for many endpoints. The GitOps-friendly model puts your entire setup (monitors, conditions, alerts) in one version-controlled YAML file. Protocol coverage is very broad: HTTP/HTTPS with custom conditions, TCP, UDP, SCTP, ICMP ping, DNS, gRPC health endpoints, SSH, STARTTLS/TLS, TLS-certificate expiration, domain-registration expiration, and push/heartbeat via external endpoints. There are 25+ notification providers out of the box (email/SMTP, Slack, Teams, Discord, Telegram, PagerDuty, Opsgenie, Twilio SMS, Datadog, custom webhooks, and more), and it ships a polished status page with incidents, announcements, badges, and history, not just alerting.
The catch. You host and maintain it yourself, including the infrastructure, updates, and the database (SQLite or PostgreSQL) for history. There is no global probe network, so checks originate from wherever you deploy it, and a single instance can’t natively detect region-specific outages or tell “your box is down” from “the service is down.” Configuration is YAML/file-driven with no built-in admin UI to add endpoints, which is less approachable for non-technical users, and if your hosting environment goes down, your monitor and status page can go down with it unless you deploy redundantly.
License and self-hosting. Apache-2.0 licensed, written in Go. Self-hosted only: run it via Docker (ghcr.io/twin/gatus:stable), as a standalone Go binary, or on Kubernetes via the official Helm chart (Terraform is also supported). The single static binary has a negligibly small footprint, so cost and effort are low, and the single YAML config is ideal for GitOps. It is actively maintained, with the latest release around v5.36.0 (May 2026) and roughly 11.4k GitHub stars.
12. Prometheus + Blackbox Exporter: best SRE-grade, code-driven probing
What it is. The Prometheus Blackbox Exporter is a Prometheus exporter that actively probes external endpoints over HTTP/HTTPS, DNS, TCP, ICMP, and gRPC and returns the results as Prometheus metrics, which Prometheus scrapes and Alertmanager uses for alerting. It is not a standalone tool but the probing component of a full Prometheus monitoring stack, backed by the CNCF Prometheus project.
Who it’s for. Teams already running (or willing to run) a Prometheus stack who want unlimited, code-driven endpoint and cert-expiry monitoring with full control and no SaaS fees.
Key strengths. Free, fully self-hosted, and Apache-2.0 with no per-check or per-monitor pricing, so it scales to unlimited targets at no cost versus paid SaaS. It is battle-tested and integrates natively with Prometheus, Alertmanager, and Grafana for powerful querying, alerting, and dashboards. Because it probes from your own network and vantage points, it can monitor internal services and endpoints that external SaaS probes can’t reach. Probing is flexible: HTTP/HTTPS (with regex and CEL-based body matching), TCP, ICMP, DNS, gRPC, TLS certificate expiry (exposed as the probe_ssl_earliest_cert_expiry metric), and, since v0.28.0, HTTP/3 and Unix domain socket probing.
The catch. It is not a standalone monitoring tool: it only emits metrics and requires Prometheus (and typically Alertmanager plus Grafana) to schedule probes, alert, and visualize, which is significant setup and ongoing maintenance. There is no global or distributed probe network out of the box, so you must build multi-region coverage yourself, and there is no built-in UI, status page, dashboards, or notification channels (all of that comes from other tools you configure). You own all hosting, uptime, upgrades, and the meta-problem of monitoring the monitor.
License and self-hosting. Apache-2.0 licensed, written in Go. Run it as a single static Go binary or via the official Docker/OCI image on Quay.io; a maintained prometheus-community Helm chart exists for Kubernetes. The exporter itself is lightweight (low CPU and memory), but a full stack also needs Prometheus, Alertmanager, and usually Grafana, so overall setup and maintenance effort is moderate-to-high. It has no internal scheduler, so the effective check interval is set by the Prometheus scrape_interval (commonly 15s to 60s). It is actively maintained as part of the official Prometheus project (around 5.8k GitHub stars), with the latest release around v0.28.0 (late 2025).
How to choose the right monitor for you
The best tool depends almost entirely on who you are. Here’s the short version.
Solo developer or small site owner
You want cheap or free, dead-simple uptime and SSL-expiry checks with a couple of alert channels. Pulsetic’s free tier is the sweet spot here: 10 monitors plus actual branded status pages at no cost. UptimeRobot’s free 50 monitors are tempting if your use is strictly personal and 5-minute checks are fine. If you have a spare VPS or Raspberry Pi, Uptime Kuma gives you free, self-hosted monitoring and a status page for the cost of a little setup.
Agency or freelancer managing many client sites
You need multi-site dashboards, branded and white-label status pages, per-client organization, and rock-solid SSL/domain-expiry tracking across many clients (a silent cert expiry takes a client offline). Pulsetic fits well thanks to its strong branded status pages and clean multi-site UI; StatusCake is the budget all-rounder if you also want domain, page-speed, and Linux server checks in the same tool.
Growing SaaS
Now reliability affects your own SLAs. You want API and synthetic transaction monitoring for critical funnels (signup, login, checkout), sub-minute checks from multiple regions, on-call/escalation, status pages for your customers, and PagerDuty/Slack/Opsgenie integration. Better Stack bundles uptime, status pages, and on-call neatly; Checkly is the pick if you want those synthetic flows defined as code in your pipeline; Pulsetic covers the uptime-and-status-page side beautifully if you handle synthetics elsewhere.
Enterprise or SRE team
You need full-stack observability (infrastructure metrics, traces, logs, RUM, synthetic and API monitoring unified) plus high check frequency, SLA/SLO tracking, RBAC, SSO/SAML, and deep incident workflows. Datadog Synthetics fits teams already on Datadog; Site24x7 offers the broadest single-platform coverage at a lower entry price; Uptime is strong when SLA reporting and polished public/private status pages are the priority.
If you want to self-host
If you would rather own the stack and pay nothing per monitor, start with Uptime Kuma: it is the easiest to stand up (one Docker command) and gives you a polished dashboard, broad monitor types, and status pages out of the box. Choose Gatus if you prefer config-as-code, where your whole setup is one version-controlled YAML file. Go with Prometheus plus Blackbox Exporter if you want SRE-grade, code-driven probing wired into Prometheus, Alertmanager, and Grafana, and you are comfortable running that stack.
A reminder worth repeating: monitoring tells you whether visitors can reach your site, while web analytics tools tell you what they do once they’re there. They’re two halves of the same picture, and most teams want both. And whatever you pick, a good status page does more for customer trust during an outage than any number of apology emails.
FAQ
What is the best website monitoring tool in 2026?
For most web developers, agencies, and site owners, Pulsetic is the best all-around pick: 30-second checks on its Team plan, multi-channel alerts (email, SMS, voice, Slack, Teams), and best-in-class branded status pages available even on its free tier. If you need a generous free tier on a tight budget, UptimeRobot offers 50 free monitors (personal use only). DevOps and SRE teams that want uptime, on-call, and observability in one platform should look at Better Stack, while teams already on Datadog get the most from Datadog Synthetic Monitoring. If you would rather self-host, Uptime Kuma is the standout free, open-source choice. The “best” tool really depends on which monitoring types you need: uptime-only buyers and full-observability buyers should choose very differently.
Is there a free website monitoring tool, and is the free tier good enough?
Yes, several. UptimeRobot’s free tier is the most generous on monitor count (50), but it’s fixed at 5-minute checks and restricted to personal, non-commercial use since December 2024. Pulsetic’s free plan is the best for status pages: 10 monitors plus 3 branded status pages at no cost. Better Stack (10 monitors + 10 heartbeats), Checkly (10 monitors, monitoring-as-code), and StatusCake (10 monitors) all have usable free tiers too. If you can host it yourself, open-source tools like Uptime Kuma and Gatus are completely free with no monitor caps. Free tiers are genuinely good enough for hobby sites, side projects, and small business sites that can tolerate 3 to 5-minute detection. You’ll outgrow free once you need sub-minute checks, SMS/voice alerts, multiple status pages, or commercial-use terms.
How often should a website be checked, and what interval do I need?
Your check interval sets your detection blind spot. A 5-minute interval means your site can be down for nearly five minutes before the first failed check even registers, then add alert delivery and your response time on top. For hobby and low-stakes sites, 5-minute checks are fine. For business sites where downtime costs money, aim for 1-minute checks. For revenue-critical production systems (e-commerce, SaaS), 30-second checks meaningfully shrink the window before customers notice. Faster checks cost more and add slightly more load, so match the interval to how costly each minute of undetected downtime is for you.
What is the difference between synthetic monitoring and real-user monitoring (RUM)?
Synthetic monitoring runs scripted browser or API robots that replay defined journeys (log in, search, checkout) on a schedule from controlled locations, asserting each step works. It gives you consistent, traffic-independent baselines and can test flows before launch or on low-traffic pages. RUM does the opposite: a JavaScript snippet collects real performance and error data from your actual visitors’ browsers, segmented by device, geography, and connection. RUM reflects the true field experience (and aligns with Google’s CrUX ranking signals) but only sees the users you already have. Most mature teams use both: synthetic for proactive coverage of critical funnels, RUM for ground truth on real-world experience. Tools like Pingdom, Site24x7, Uptime, and Better Stack offer both; lighter tools focus on one side (Pulsetic on uptime and status pages, Checkly on synthetic) without RUM.
What is the difference between uptime monitoring and full observability platforms like Datadog?
Uptime monitoring is external and focused: it checks from the outside whether your site responds correctly, fast enough, with a valid certificate, and alerts you when it doesn’t. Tools like Pulsetic, UptimeRobot, StatusCake, and the self-hosted Uptime Kuma live here: they’re cheap or free, simple, and quick to set up. Full observability platforms like Datadog (and to a degree Site24x7 and Better Stack) go much further inside your stack: infrastructure metrics, distributed traces, logs, RUM, and synthetic tests, all correlated so a failed check links to its backend root cause. The trade-off is cost and complexity: observability platforms use usage-based or modular pricing that’s harder to predict and have a steeper learning curve. If you only need “is my site up and fast?”, a focused uptime tool is the right call; if you’re debugging a complex distributed system, you’ll want observability.
Do I need uptime monitoring if I already use a web host or CDN?
Yes. Your host or CDN monitors its own infrastructure, not your specific application: a host can be perfectly healthy while your site returns a 500 error, your SSL certificate expires, your database connection drops, or a deploy breaks the checkout flow. Independent, third-party monitoring checks your site the way a real user would, from outside your own infrastructure, so you find out before your customers do. It also gives you neutral evidence to hold a host accountable to its SLA. CDNs add resilience, but they can’t catch application-level failures, and a misconfigured CDN can itself be the cause of an outage.
How much does website monitoring cost per month?
It ranges from free to enterprise-scale. Hosted free tiers (Pulsetic, UptimeRobot, StatusCake, Better Stack, Checkly) cover hobby and small sites at $0, and open-source self-hosted tools (Uptime Kuma, Gatus, Prometheus + Blackbox Exporter) are free to run on your own hardware. Entry paid plans for serious uptime monitoring run roughly $7 to $24/mo, for example Pulsetic Solo at $9/mo, UptimeRobot Solo from $7/mo annual, or Site24x7 Web Uptime ~$9/mo annual. Broader suites with synthetic, RUM, and transaction monitoring (Uptime from $20/mo, Pingdom, Better Stack with telemetry) typically land in the $20 to $100+/mo range, and usage-based platforms like Datadog Synthetics scale with how many test runs you generate. Watch for add-on costs: SMS/voice credits, extra status pages, and additional probe locations are billed separately on several tools, so the headline price isn’t always the real one.
What is the best open-source website monitoring tool?
Uptime Kuma is the best open-source website monitoring tool for most people: it’s MIT-licensed, completely free, and self-hosted, with a polished real-time dashboard, broad monitor types (HTTP, keyword, JSON, TCP, ping, DNS, certificate and domain expiry, and push/heartbeat), 90+ notification integrations, and built-in public status pages, all from a single Docker command. If you prefer config-as-code, Gatus defines your entire setup (monitors, conditions, alerts) in one version-controlled YAML file and is ideal for GitOps. If you already run a Prometheus stack, the Prometheus Blackbox Exporter gives you SRE-grade, code-driven probing wired into Prometheus, Alertmanager, and Grafana. The trade-off with all of them is that you host and maintain the monitor yourself, and there is no managed global probe network by default.
Build your Bootstrap theme
Design a custom Bootstrap 5 theme visually with a live preview, then export clean Sass or CSS.
Open the Builder