10 Best API Monitoring Tools in 2026 (Free and Paid)
Your API can be “up” and still broken. It can answer every request with 200 OK and an empty list, take eight seconds to respond, reject a valid token after a key rotation, or fail only in one region. API monitoring catches these by calling your endpoints on a schedule, from several locations, and checking not just that they respond but that they respond correctly and quickly enough.
This guide compares ten API monitoring tools in November 2026, from simple endpoint uptime checks to multistep API tests written in code. Prices are from each vendor’s own pricing page or documentation, in US dollars unless we say otherwise.
The short version:
- Best for developers: Checkly, with API checks and multistep tests in code, deployed from CI.
- Best for endpoint uptime with status pages: Pulsetic, with header and keyword checks from up to 15 locations, alerts on many channels, and status pages on your own domain, free to start.
- Best if you already test in Postman: Postman Monitors, which run your existing collections on a schedule.
- Best inside an observability platform: Datadog API tests.
- Most generous free allowance: Grafana Cloud, with 100,000 API test runs a month free.
- Best for uptime plus on-call: Better Stack.
- Most free monitors: UptimeRobot, with 50.
- Most checkpoint locations: Uptrends.
- Best for SLA reporting: Uptime.com.
- Best free self-hosted: Uptime Kuma.
What API monitoring checks
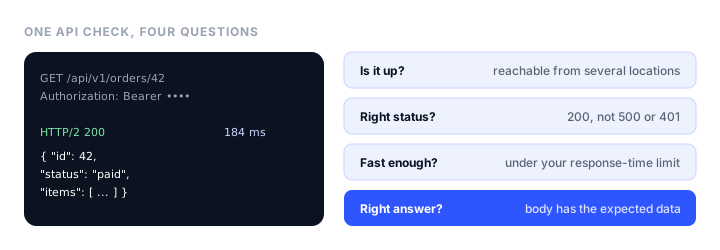
A good API monitor answers four questions on every run:
- Is it reachable? The endpoint answers from several locations, so a regional network problem or DNS failure shows up.
- Is the status code right? A
500,502, or an unexpected401after a credential change all mean something broke. - Is it fast enough? Response time stays under a limit you set, since a slow API breaks the apps that call it even when it never goes down.
- Is the answer right? The response body contains what it should: a field, a value, or at least not an error message hidden inside a
200.
More advanced tools add multistep checks, which chain calls the way a real client does (log in, take the token, create an order, read it back, delete it), schema validation against your OpenAPI definition, and checks on the SSL certificate of the API’s domain. Two more things are worth monitoring alongside the API itself: the services behind it, such as the database port, and the scheduled jobs and queue workers it depends on, usually with heartbeat monitors.
How we picked
- Check depth: single requests with status and keyword checks, or assertions on JSON fields, headers, and multistep flows.
- Authentication: support for headers, tokens, and secrets, so you can monitor real endpoints rather than only a public health check.
- Locations and frequency: how many places checks run from and how often, and which plan you need for it.
- Alerting: where alerts go, and whether a failure is confirmed from a second location before anyone is woken up.
- Cost at a realistic schedule: several endpoints every minute is tens of thousands of runs a month, which some tools include and others bill per run.
API monitoring tools at a glance
| Tool | Check style | Free tier | Paid from | Fastest checks |
|---|---|---|---|---|
| Checkly | Code or UI, multistep | 10,000 API runs a month | $24/mo (yearly) | 30 seconds (Team) |
| Pulsetic | HTTP with headers and keyword checks | 10 monitors, 5-minute checks | $9/mo | 30 seconds (Team) |
| Postman Monitors | Collections with test scripts | 1,000 requests a month | $9/mo (Solo, yearly) | Plan-dependent |
| Datadog | Single and multistep API tests | 14-day trial | $5 per 10,000 runs (yearly) | 1 minute |
| Grafana Cloud | HTTP, multistep, k6 scripts | 100,000 API runs a month | $19/mo platform fee | Plan-dependent |
| Better Stack | HTTP with request settings | 10 monitors, 3-minute checks | $29/mo per seat (yearly) | 30 seconds |
| UptimeRobot | HTTP and keyword | 50 monitors, 5-minute checks | €9/mo (yearly) | 30 seconds (Team) |
| Uptrends | Single and multistep API | 30-day trial | $60/mo (Pro, yearly) | 1 minute (Pro) |
| Uptime.com | API and transaction checks | No | $9/mo | 1 minute |
| Uptime Kuma | HTTP, keyword, JSON query | Free, self-hosted | Free | 20 seconds |
The best API monitoring tools, reviewed
1. Checkly: best for developers
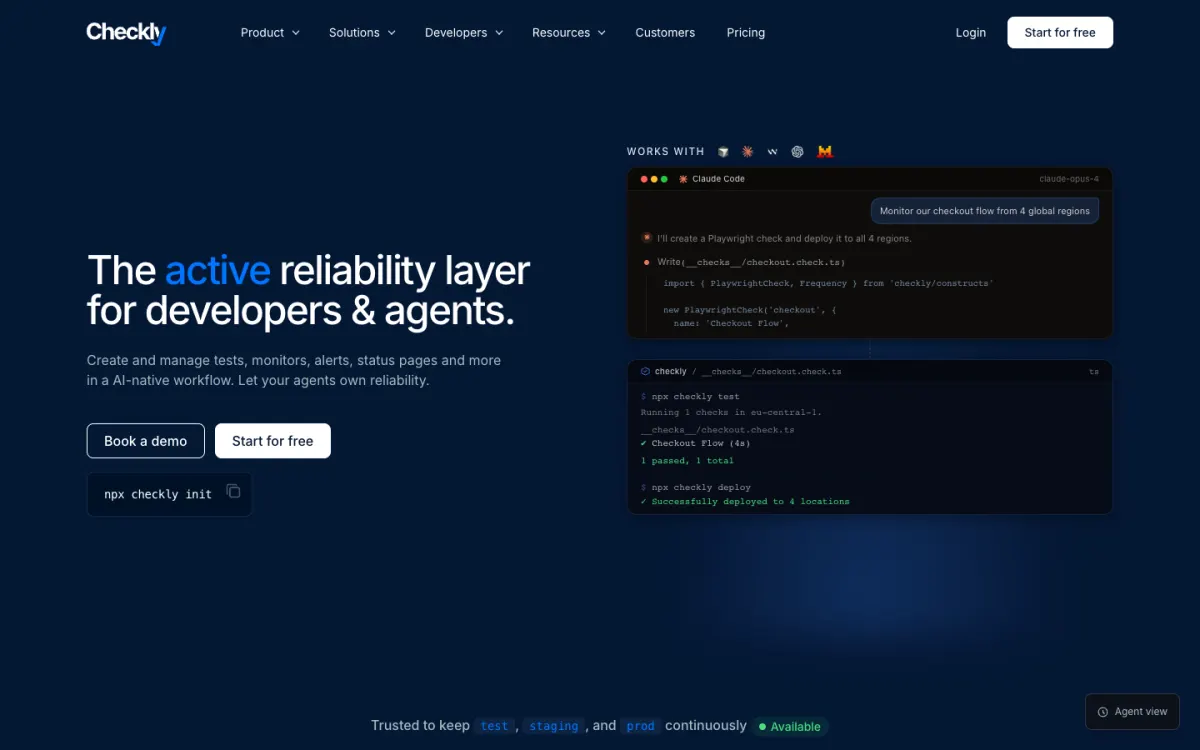
What it is. Checkly is a monitoring-as-code platform. API checks are defined in TypeScript or the UI, with assertions on status, headers, response time, and JSON body, and multistep checks chain requests with Playwright’s API testing tools.
Why it stands out. Checks live in your repository and deploy from CI with the Checkly CLI, so monitors change with your code and can run against preview deployments before you merge. Setup and teardown scripts handle authentication, such as fetching a token before the request. Integrations include Terraform, Pulumi, PagerDuty, Opsgenie, and Datadog.
What to know. It is built for developers, so non-technical teammates will need help to add checks. Usage beyond the plan is billed per run, and the free plan is limited to 6 locations and 2-minute checks.
Pricing (billed yearly). Hobby free: 10 monitors and 10,000 API runs a month. Starter $24/mo (1-minute checks). Team $64/mo (30-second checks, 21 locations). Enterprise custom.
2. Pulsetic: best for endpoint uptime with status pages
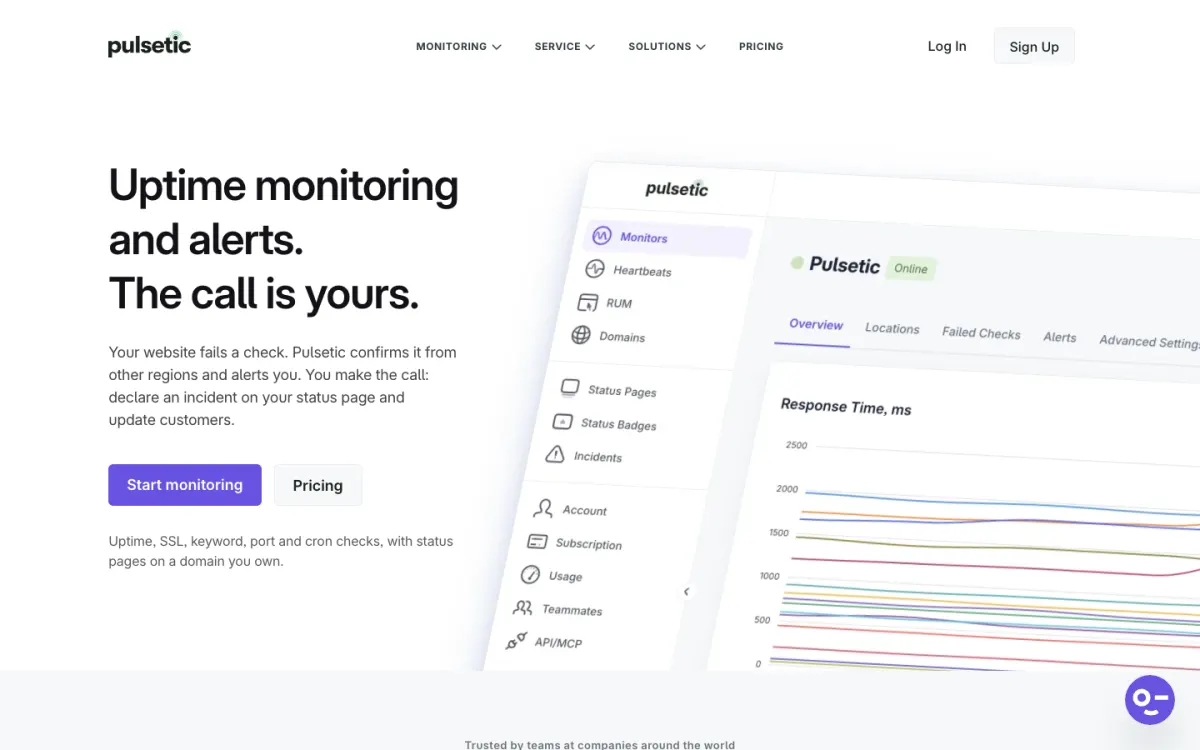
What it is. Pulsetic is a monitoring service whose HTTP monitors check API endpoints for status codes and response time from up to 15 locations, alongside SSL, port, heartbeat, and domain monitoring and hosted status pages.
Why it stands out. It covers what most teams need from API monitoring without writing code. Advanced request settings send the headers an endpoint expects, such as an API key or bearer token, and keyword monitoring checks the response body for text that should or shouldn’t be there, so an empty payload or an error inside a 200 still raises an alert. An alert goes out once a second location confirms the failure, which cuts false alarms. Port monitors watch the database or cache behind the API, heartbeat monitors catch a scheduled job that stopped, and a status page on your own domain shows customers your API’s uptime. Alerts go by email and webhook on every plan, and by SMS, WhatsApp, phone call, Slack, Teams, Discord, Telegram, and Zapier on paid plans.
What to know. Pulsetic’s API monitors are single requests with keyword matching on the body. For flows that chain several calls, or assertions on individual JSON fields, Checkly or Postman fit better. PagerDuty works through a webhook rather than a native integration.
Pricing. Free $0 (10 monitors, 5-minute checks from 3 locations, 3 status pages). Solo $9/mo (60-second checks from 5 locations). Team $19/mo (50 monitors, 30-second checks from 15 locations). Organization $49/mo. Two months free on yearly billing.
3. Postman Monitors: best if you already test in Postman
What it is. Postman is the most widely used API client, and its Monitors run a Postman collection on a schedule from Postman’s cloud, with the test scripts you already wrote.
Why it stands out. If your team designs and tests APIs in Postman, monitoring is a few clicks away: the same requests, environments, and pm.test assertions become a scheduled check, and a collection naturally works as a multistep flow, passing a token or an ID from one request to the next.
What to know. The allowance is counted in requests, and every request in a collection counts, so a ten-request collection run every hour uses about 7,200 requests a month, well past the free plan. Alerting and status pages are basic next to dedicated monitoring tools, and Team is billed per user.
Pricing (billed yearly). Free: 1,000 monitoring requests a month. Solo $9/mo and Team $19 per user/mo, each with 10,000 monitoring requests a month. Enterprise custom.
4. Datadog API tests: best inside an observability platform
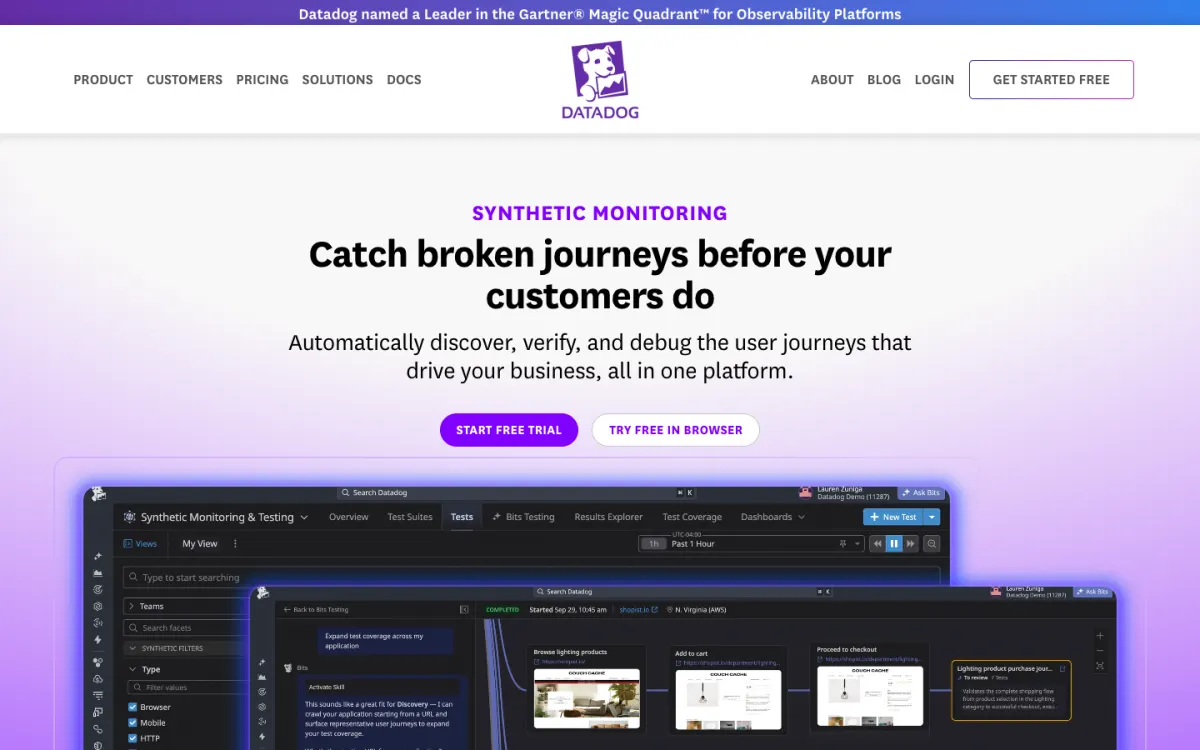
What it is. Datadog Synthetic Monitoring includes API tests for HTTP, gRPC, WebSocket, SSL, DNS, TCP, UDP, and ICMP, plus multistep API tests, from managed and private locations.
Why it stands out. A failed API test links to the traces, logs, and metrics behind it, so you go from “the orders endpoint is slow” to the slow database query in one place. Private locations test internal APIs that aren’t exposed to the internet, and tests run in CI as well as on a schedule.
What to know. Billing is per run, so many endpoints checked every minute from several locations add up quickly. It makes most sense if you already use Datadog.
Pricing (billed yearly). API tests $5 per 10,000 runs a month. 14-day trial.
5. Grafana Cloud Synthetic Monitoring: most generous free allowance
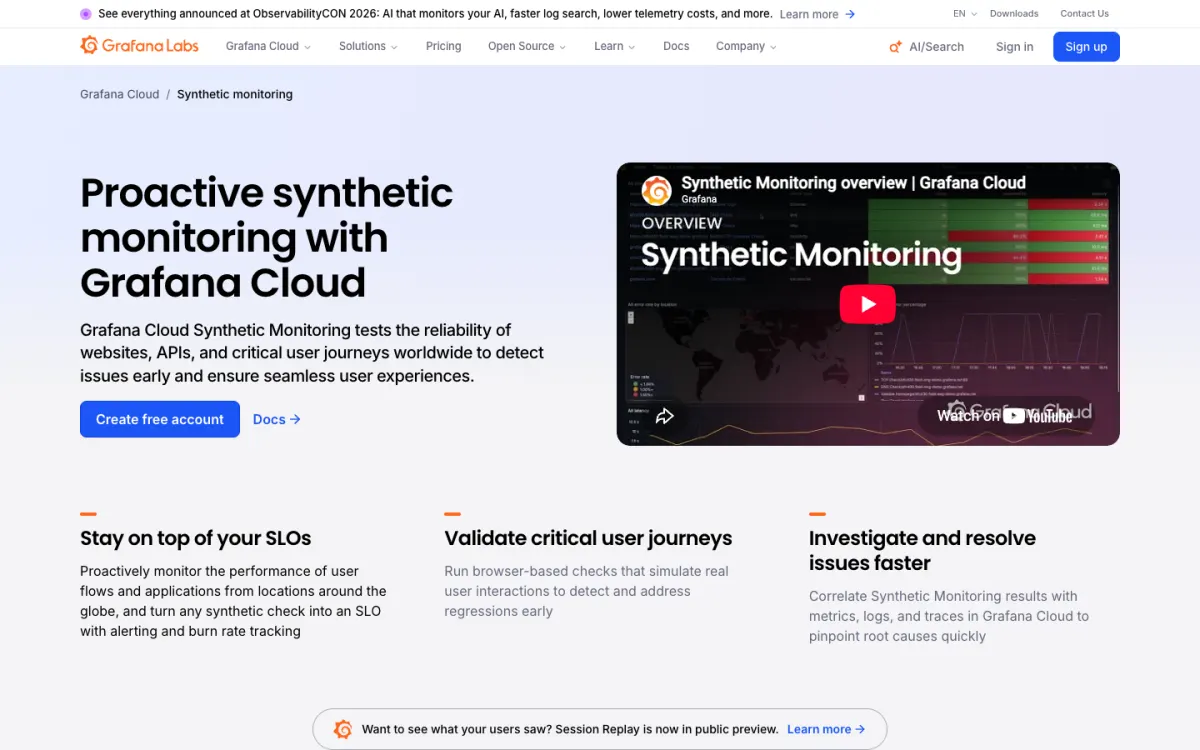
What it is. Grafana Cloud Synthetic Monitoring runs HTTP, multistep HTTP, DNS, TCP, and ping checks, plus scripted checks written with k6, with results in Grafana dashboards.
Why it stands out. 100,000 API test runs a month are free, enough for several endpoints every few minutes. Checks can feed service level objectives with burn-rate alerts, and k6 scripts can be reused for load testing.
What to know. It fits best if you already use Grafana; on its own, it takes more setup than an uptime-first tool, and there are no hosted public status pages.
Pricing. Free: 100,000 API test runs a month. Pro: a $19 a month platform fee, then from $5 per 10,000 API runs.
6. Better Stack: best for uptime plus on-call
What it is. Better Stack combines uptime and API monitoring with incident management, on-call scheduling, status pages, and logs.
Why it stands out. HTTP monitors take custom methods, headers, and request bodies, and a failed check can page the on-call engineer by phone and update the status page from one platform. Playwright monitors cover scripted flows when a single request isn’t enough.
What to know. Pricing combines seats and usage add-ons, so the bill takes some estimating. The free tier checks every 3 minutes.
Pricing. Free: 10 monitors and 10 heartbeats. Responder seats $34/mo, or $29/mo billed yearly.
7. UptimeRobot: most free monitors
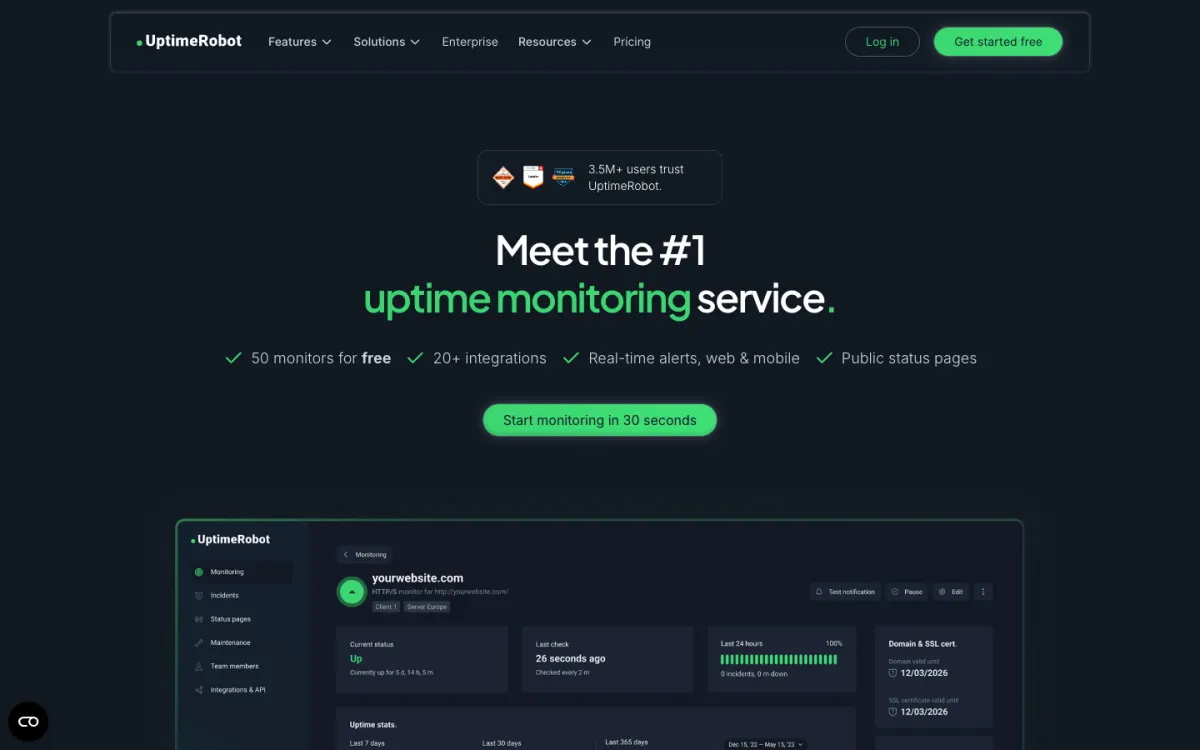
What it is. UptimeRobot is a popular, low-cost monitor with HTTP, keyword, ping, port, heartbeat, SSL, and DNS checks.
Why it stands out. The free plan’s 50 monitors cover a lot of endpoints, and keyword monitors check the response body for expected text. It is simple to set up and has a long track record.
What to know. Checks are single requests. The free plan checks every 5 minutes, and the cheapest paid plan covers 10 monitors unless you choose its larger option. SMS and voice alerts cost extra credits.
Pricing (shown in euros). Free: 50 monitors, 5-minute checks. Solo €9/mo billed yearly (10 monitors, 60-second checks). Team €35/mo billed yearly (100 monitors, 30-second checks).
8. Uptrends: most checkpoint locations
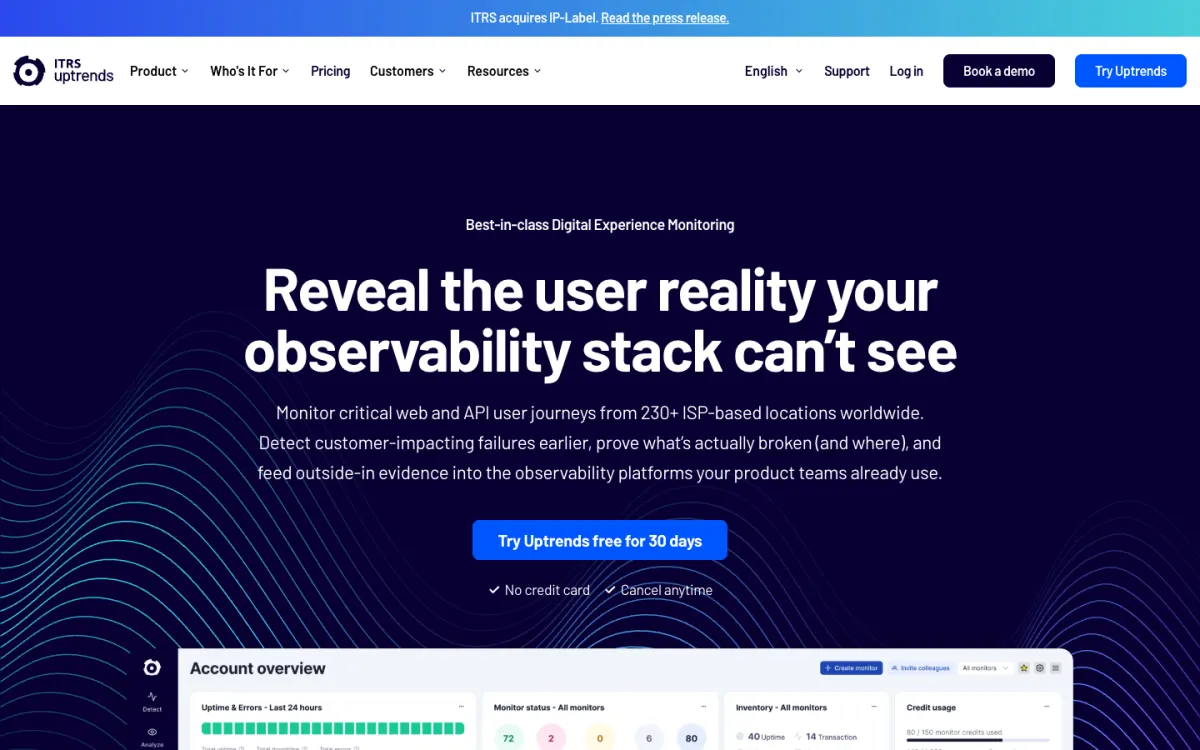
What it is. Uptrends monitors websites, APIs, and user journeys from more than 230 checkpoints, with single and multistep API monitors.
Why it stands out. Multistep API monitors pass values between requests, and the checkpoint network lets you test from specific countries and cities. The Enterprise plan adds checkpoints inside your own network.
What to know. API monitoring starts on the Pro plan, not the cheaper Core plan. API checks run every minute on Pro and every 30 seconds on Enterprise, and usage is counted in credits.
Pricing. Pro $66/mo ($60 billed yearly) with API and transaction monitoring. Enterprise custom. 30-day free trial with no card.
9. Uptime.com: best for SLA reporting
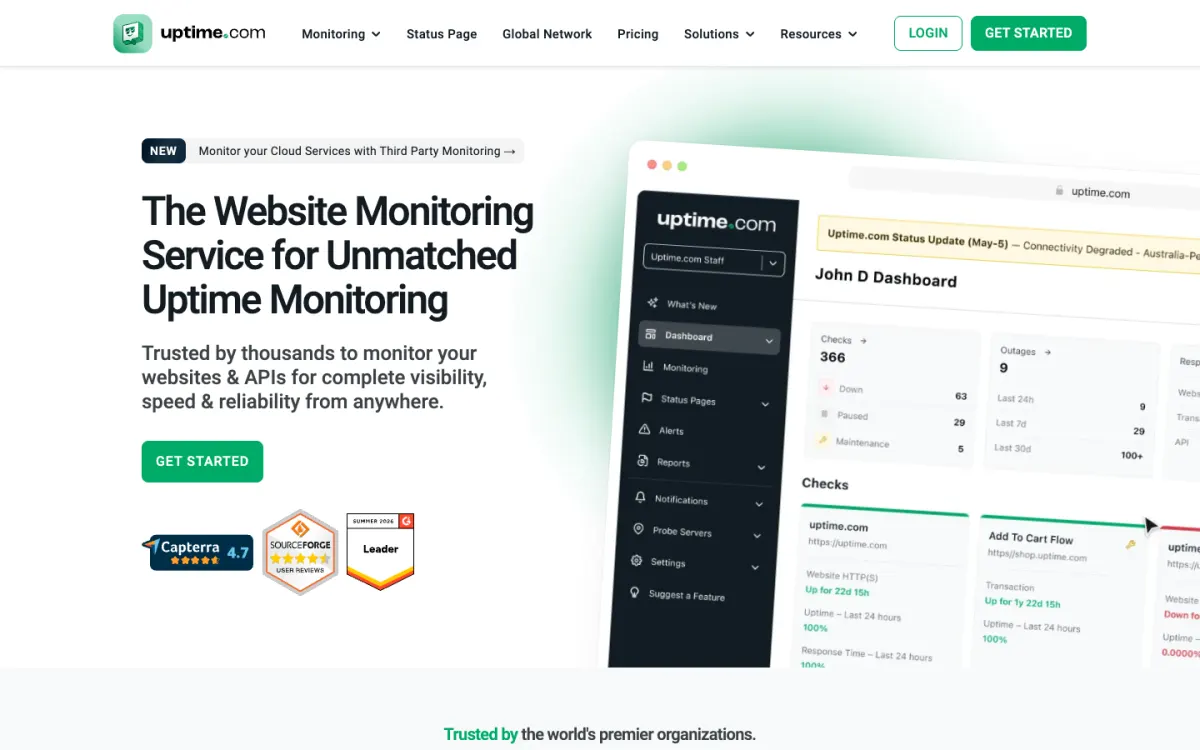
What it is. Uptime.com combines uptime, API, and transaction checks with real-user monitoring and public and private status pages.
Why it stands out. API checks are built step by step without code, and SLA reports show customers or management how an API performed over a period.
What to know. There is no free tier, and API checks count as advanced checks, of which the entry plan includes one. Status pages are an add-on.
Pricing. From $9/mo or $84/yr for 10 basic checks and 1 advanced check, then $19/mo for 25 checks, $38 for 50, and $75 for 100. Status pages $13/mo each.
10. Uptime Kuma: best free self-hosted
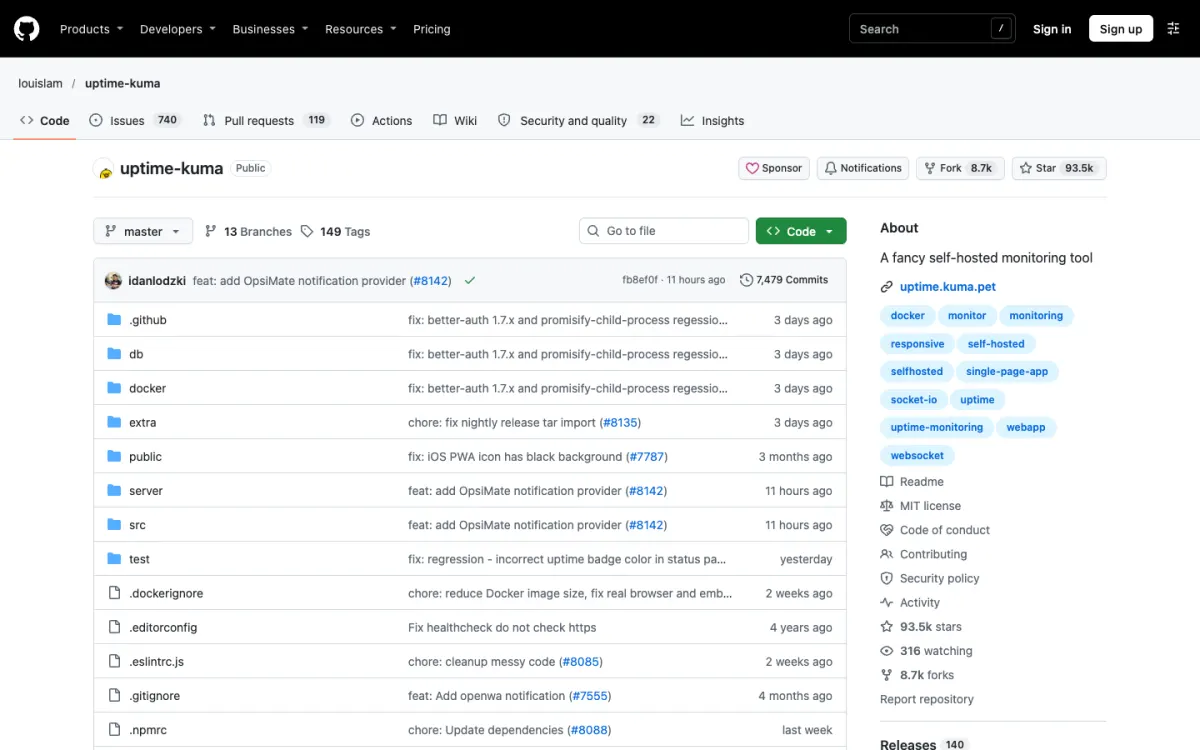
What it is. Uptime Kuma is a free, open-source monitor you run yourself, usually with one Docker command.
Why it stands out. It checks HTTP endpoints with custom headers and bodies, keyword matching, and JSON queries on the response, as often as every 20 seconds, with public status pages and more than 90 notification services. There are no fees of any kind.
What to know. One instance checks from one place, so your own network problems look like outages, and if the server running it goes down, your monitoring goes with it. Run it somewhere other than the API it watches.
Pricing. Free (MIT license); you pay only for the server.
Design a health endpoint worth monitoring
A monitor is only as good as what it calls. Two habits make API monitoring much more useful:
Add a health endpoint that checks dependencies. A /health route that returns 200 as long as the web server runs tells you little. Have it check the database, cache, and any critical third-party service, and return a non-200 status when one fails:
{
  "status": "ok",
  "checks": {
    "database": "ok",
    "cache": "ok",
    "payments": "ok"
  },
  "version": "2026.11.12"
}
Keep it fast and unauthenticated, but don’t expose secrets or internal details in it.
Monitor real endpoints too. A health check can pass while a real route fails, for example after a bad deploy of one handler. Add monitors for a few endpoints your customers depend on, with a test account and a token kept in the monitoring tool’s secrets, and check the body for a field that should always be there.
Is there a free API monitoring tool?
Yes, several:
- Grafana Cloud includes 100,000 API test runs a month.
- Checkly includes 10,000 API runs a month on Hobby.
- UptimeRobot includes 50 monitors at 5-minute intervals.
- Pulsetic includes 10 monitors at 5-minute intervals, with 3 status pages on your own domain.
- Better Stack includes 10 monitors at 3-minute intervals.
- Postman includes 1,000 monitoring requests a month.
- Uptime Kuma is free to self-host.
How to choose an API monitoring tool
- You write your checks in code and deploy from CI: Checkly.
- You want endpoint uptime, keyword checks, and a status page without code: Pulsetic.
- Your team already tests APIs in Postman: Postman Monitors.
- You run Datadog: Datadog API tests.
- You use Grafana and want a large free allowance: Grafana Cloud.
- You need on-call scheduling in the same tool: Better Stack.
- You want the most free monitors: UptimeRobot.
- You need to test from many specific countries: Uptrends.
- You report SLAs: Uptime.com.
- You want it free and self-hosted: Uptime Kuma.
If you are also watching websites and user journeys, our guides to the best website monitoring tools and synthetic monitoring tools cover those, and status pages covers telling users when something breaks.
FAQ
What is API monitoring?
API monitoring calls your API endpoints on a schedule, from one or more locations, and checks that they respond with the right status code, within an acceptable time, and with the expected content. It alerts you when an endpoint goes down, slows down, or starts returning errors.
What are the best API monitoring tools?
Checkly is the best API monitoring tool for developers, with checks defined in code. Pulsetic is best for endpoint uptime with keyword checks and status pages, from a free plan. Postman Monitors suit teams already testing in Postman, and Datadog suits teams on its observability platform.
Is there a free API monitoring tool?
Yes. Grafana Cloud includes 100,000 API test runs a month free, Checkly 10,000 API runs, UptimeRobot 50 monitors at 5-minute intervals, and Pulsetic 10 monitors with status pages. Uptime Kuma is free and open source if you host it yourself.
What is the difference between API monitoring and API testing?
API testing checks that an API works correctly before release, usually in CI against a test environment. API monitoring runs similar checks continuously against production, from several locations, and alerts you when something fails. Tools such as Checkly and Postman let you reuse the same checks for both.
How often should I monitor my API?
Check critical endpoints every 30 seconds to 1 minute, and less critical ones every 5 minutes. Faster checks find outages sooner but cost more on per-run pricing, so match the interval to how much a minute of downtime costs you.
Can I monitor an API that requires authentication?
Yes. Most API monitoring tools let you send headers such as an API key or bearer token with each check, and store them as secrets. Tools with multistep checks, such as Checkly, Postman, and Datadog, can also log in first and pass the token to the next request.
What is the difference between API monitoring and uptime monitoring?
Uptime monitoring checks that a website or endpoint responds. API monitoring goes further: it checks the status code, response time, and response body of each endpoint, often with authentication, and in advanced tools follows multistep flows the way a real client does.
Build your Bootstrap theme
Design a custom Bootstrap 5 theme visually with a live preview, then export clean Sass or CSS.
Open the Builder