10 Best Synthetic Monitoring Tools in 2026 (Free and Paid)
An uptime check tells you the homepage answers. It doesn’t tell you that the login button stopped working, that checkout fails after the payment step, or that an API returns 200 with an empty body. Synthetic monitoring closes that gap: it runs scripted visits and API calls against your site on a schedule, from locations around the world, and alerts you when a step fails, before your users report it.
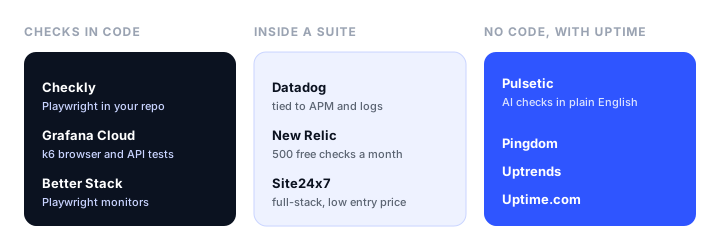
This guide compares ten synthetic monitoring tools in November 2026: what kinds of checks each runs, how you build them, what the free tier covers, and what it really costs once you run checks often. Prices are from each vendor’s own pricing page or documentation, in US dollars unless we say otherwise.
The short version:
- Best for developers: Checkly, with Playwright browser checks and API checks defined in your repository.
- Best without writing code: Pulsetic, whose AI monitors follow a plain-English instruction in a real browser, alongside uptime checks and status pages, from $9 a month.
- Best if you already run Datadog: Datadog Synthetic Monitoring.
- Most generous free allowance: Grafana Cloud, with 100,000 API and 10,000 browser test runs a month free.
- Best free tier inside a full observability platform: New Relic, with 500 synthetic checks a month.
- Best for uptime, on-call, and scripted checks together: Better Stack.
- Best mature suite with a transaction recorder: Pingdom.
- Most checkpoint locations: Uptrends, with more than 230.
- Best low-cost full-stack platform: Site24x7.
- Best for SLA reporting: Uptime.com.
What synthetic monitoring is
Synthetic monitoring means testing your site with simulated traffic instead of waiting for real visitors. A monitor runs a predefined check on a schedule (every minute, every five minutes, or every hour) from one or more locations, and alerts you when it fails or slows down. There are three main kinds of check:
- API checks send a request to an endpoint and assert on the response: status code, response time, headers, and body content. Multistep API checks chain requests, for example logging in to get a token and then calling an endpoint with it. Our guide to API monitoring tools covers tools for this part on its own.
- Browser checks load a page in a real headless browser, run its JavaScript, and can measure load time and Core Web Vitals.
- Transaction or user journey checks are browser checks with steps: open the site, log in, search, add to cart, check out. They catch a broken funnel even when every page still loads.
Most tools also include simpler uptime checks (HTTP, keyword, SSL, DNS, TCP), which are synthetic too in the strict sense, just with a single step.
Synthetic monitoring vs real-user monitoring
Synthetic monitoring and real-user monitoring (RUM) answer different questions. Synthetic checks run the same steps from the same places on a schedule, so they catch failures even at 3 a.m. when nobody is visiting, and give you a clean baseline to compare releases against. RUM collects data from real visitors’ browsers, so it shows how the site actually performs across devices, networks, and countries, but only for pages people visit. Most teams use synthetic monitoring to find out that something is broken, and RUM to find out how fast the site really is.
How we picked
- Check types. API, multistep API, browser, and transaction checks, and how you create them: in code, with a recorder, or in plain language.
- Locations and frequency. How many places checks run from, how often they can run, and which plan you need for it.
- Pricing you can predict. Synthetic checks are usually billed per run, so we looked at what a realistic schedule costs, not just the entry price.
- Alerting and context. Where alerts go, and whether a failed check links to screenshots, traces, or logs that explain it.
- Fit for the buyer. A developer team with a CI pipeline wants something very different from a marketing team that wants to know the signup form works.
Synthetic monitoring tools at a glance
| Tool | Build checks with | Free tier | Paid from | Browser checks billed |
|---|---|---|---|---|
| Checkly | Playwright code, CLI, or UI | 10 monitors, 1,000 browser runs a month | $24/mo (Starter, yearly) | Per run beyond the plan |
| Pulsetic | Plain-English AI prompt | 10 uptime monitors, no AI monitors | $9/mo (Solo) | Monthly run allowance per plan |
| Datadog | Recorder, API test builder | 14-day trial | Usage only | $12 per 1,000 runs (yearly) |
| Grafana Cloud | k6 scripts or UI | 100,000 API and 10,000 browser runs a month | $19/mo platform fee (Pro) | $50 per 10,000 runs |
| New Relic | Scripts, step builder, or simple ping | 500 checks a month | Usage | $0.005 per check |
| Better Stack | Playwright scripts | 10 monitors and 10 heartbeats | $29/mo per Responder seat (yearly) | Usage-based |
| Pingdom | Transaction recorder | 30-day trial | €14.33/mo (yearly) | Advanced checks in the plan |
| Uptrends | Transaction recorder | 30-day trial | $60/mo (Pro, yearly) | Credits per step |
| Site24x7 | Recorder | 50 basic monitors | $9/mo (yearly) | Within plan limits |
| Uptime.com | Transaction builder | No | $9/mo | Advanced checks in the plan |
The best synthetic monitoring tools, reviewed
1. Checkly: best for developers
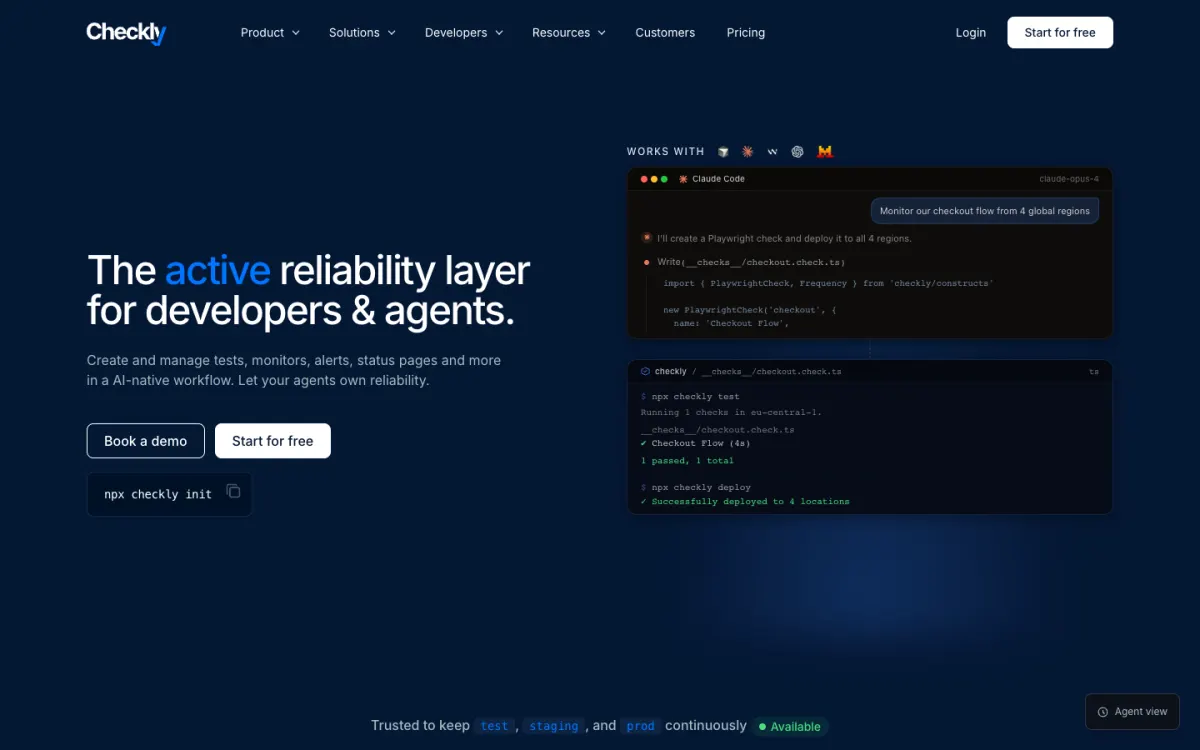
What it is. Checkly is a monitoring-as-code platform. Browser checks are real Playwright scripts, API checks are defined in code or in the UI, and everything can live in your repository and be deployed from CI with the Checkly CLI, alongside uptime, SSL, TCP, DNS, and heartbeat monitors.
Why it stands out. If your team already writes Playwright end-to-end tests, the same tests become production monitors, run from up to 21 locations, with traces, screenshots, and videos of failed runs. Checks can also run against preview deployments before you merge. Integrations lean developer: Terraform, Pulumi, Datadog, Grafana, PagerDuty, and Opsgenie.
What to know. It is code-first, so it suits developers, not marketing teams. There is no real-user monitoring. Usage beyond the plan is billed per run, the free plan is limited to 6 locations and 2-minute checks, and the full set of locations needs Team.
Pricing (billed yearly). Hobby free: 10 monitors, 10,000 API and 1,000 browser runs a month. Starter $24/mo (1-minute checks). Team $64/mo (30-second checks, 21 locations). Enterprise custom.
2. Pulsetic: best without writing code
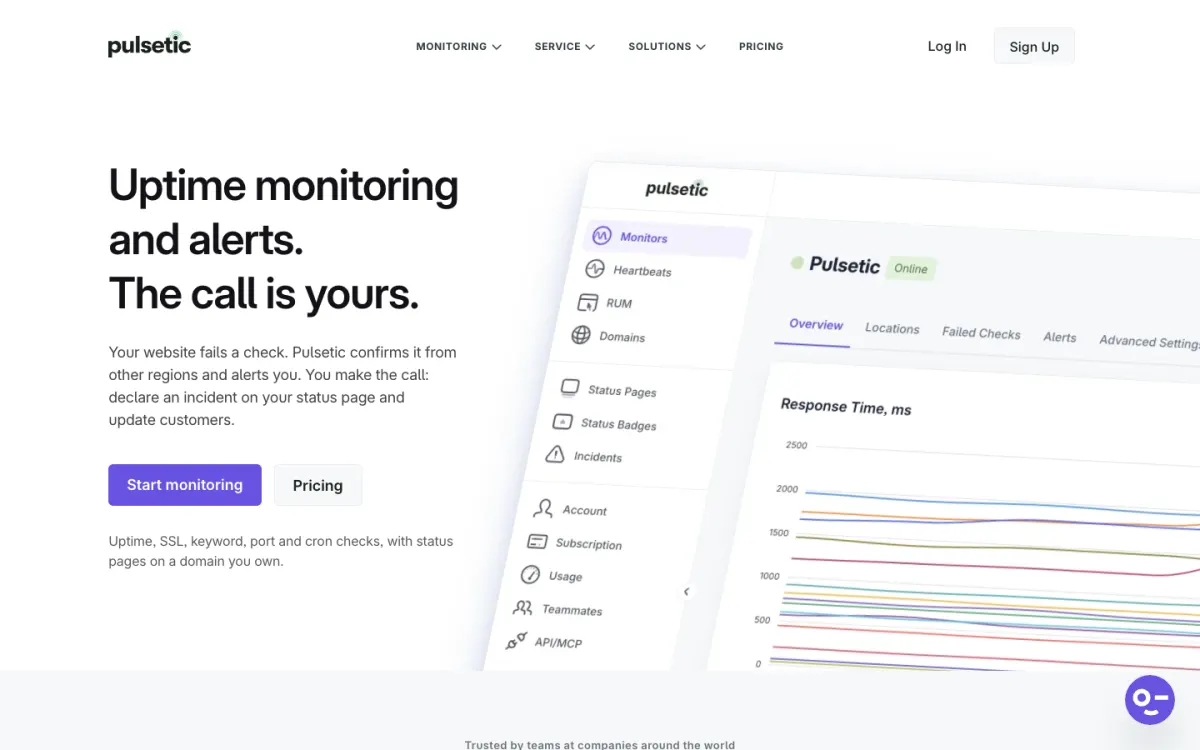
What it is. Pulsetic is a website monitoring service with uptime and keyword checks, SSL and domain monitoring, heartbeat monitors, real-user monitoring, and hosted status pages. Its AI monitors bring synthetic journey checks to people who don’t write test scripts.
Why it stands out. You describe the journey in plain English, up to 250 characters, such as “log in with the test account and open the billing page”, and an AI agent carries it out in a real browser. Every run keeps the agent’s steps (navigate, click, type) and a screenshot, so a failure shows what the agent saw. Alerts go to the same channels as the rest of Pulsetic, including email, SMS, Slack, Teams, and webhooks, on failure and on recovery. For a small team, one tool covers the uptime checks, the journey checks, and the status page that tells customers what is happening.
What to know. AI monitors are on paid plans, and scheduled runs come out of a monthly allowance (more can be bought). The fastest schedule is once a day on Solo, hourly on Team, and every 30 minutes on Organization, and the allowance runs out before the month ends at the fastest schedule, so they suit checking key journeys a few times a day rather than the continuous, minute-by-minute transaction monitoring of Checkly or Datadog. AI monitors don’t appear on status pages. PagerDuty works through a webhook rather than a native integration.
Pricing. Free $0 (10 uptime monitors, 5-minute checks, 3 status pages, no AI monitors). Solo $9/mo. Team $19/mo (50 monitors, 30-second uptime checks from 15 locations). Organization $49/mo. Yearly billing gives two months free. The pricing page lists the AI monitor run allowance for each plan.
3. Datadog Synthetic Monitoring: best if you already run Datadog
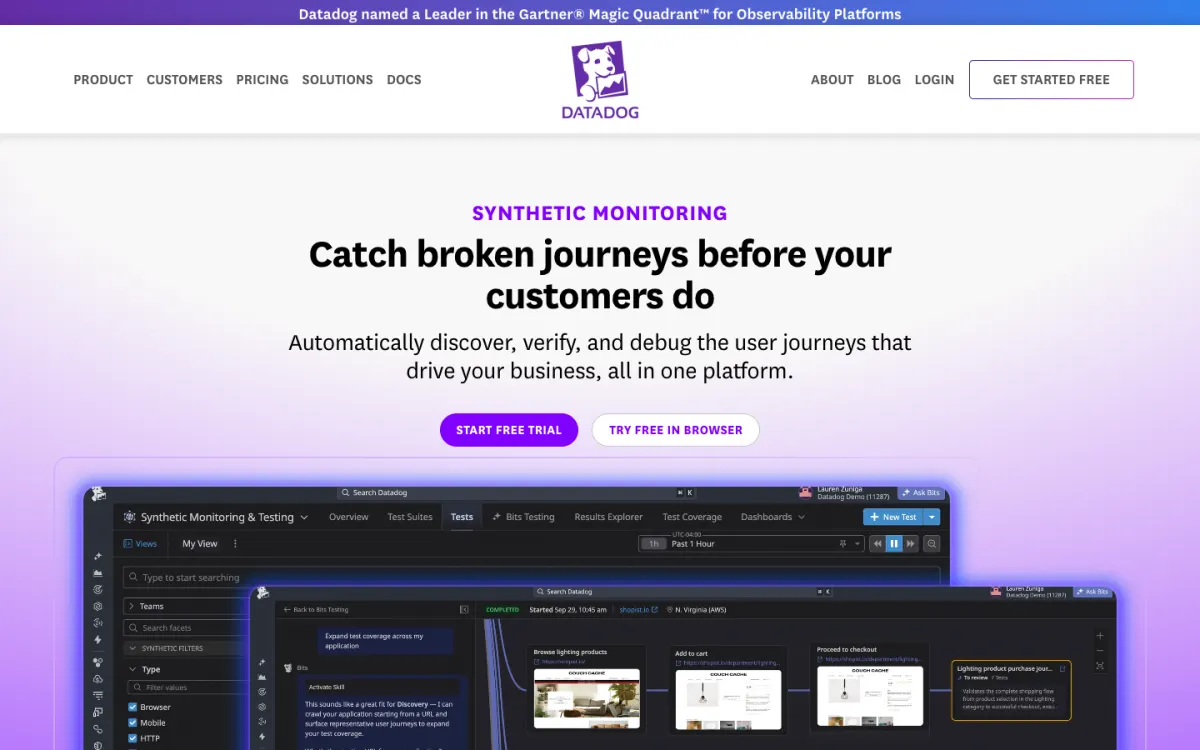
What it is. Datadog Synthetic Monitoring runs API, multistep API, browser, and mobile app tests from managed and private locations, inside the Datadog observability platform.
Why it stands out. A failing test links straight to the backend traces, logs, and infrastructure metrics behind it, which is the fastest path from “checkout is broken” to the cause. Browser tests are recorded in the browser with self-maintaining locators, so small UI changes don’t break them, and network tests cover DNS, TCP, UDP, ICMP, gRPC, WebSocket, and SSL. Tests can run in CI from GitHub, GitLab, Jenkins, and CircleCI, and private locations reach internal apps.
What to know. Pricing is per run, which adds up fast: one browser test every minute from five locations is over 200,000 runs a month. It is far more than you need for simple uptime checks, and public status pages are a separate product.
Pricing (billed yearly). API tests $5 per 10,000 runs a month. Browser tests $12 per 1,000 runs. Mobile app tests $50 per 100 runs. 14-day trial.
4. Grafana Cloud Synthetic Monitoring: most generous free allowance
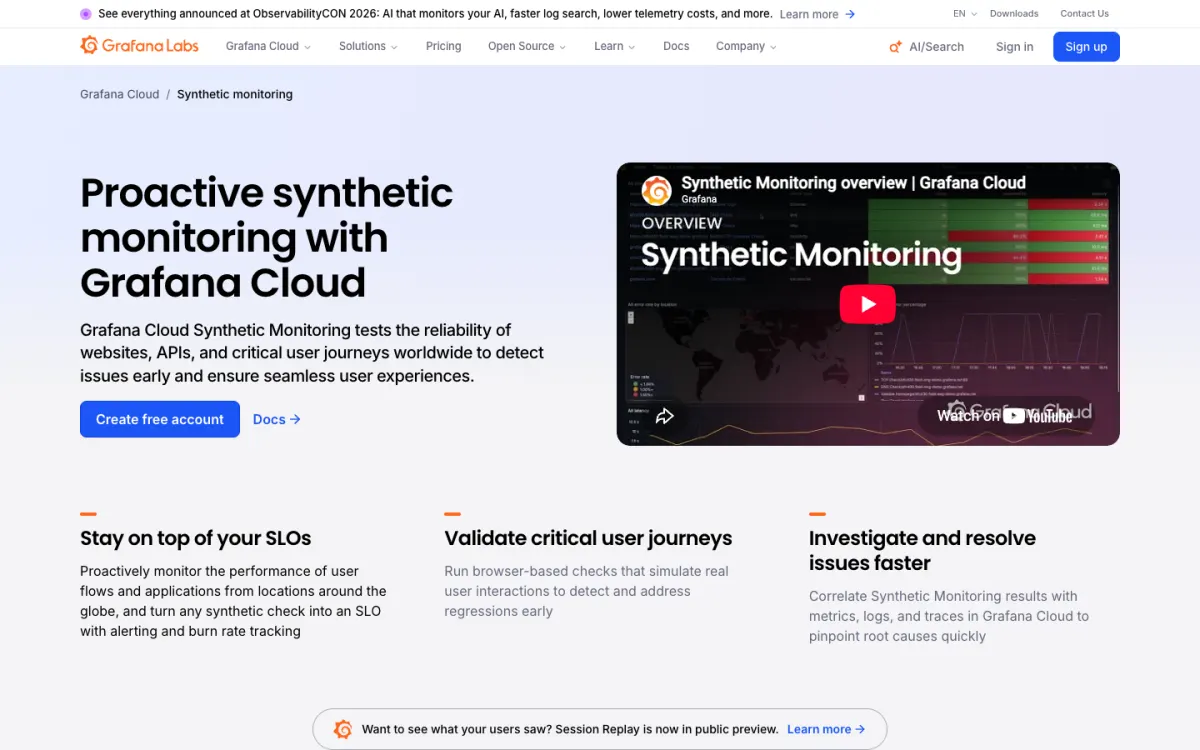
What it is. Grafana Cloud Synthetic Monitoring runs ping, DNS, TCP, HTTP, multistep API, and k6 browser checks, with results in Grafana dashboards next to your metrics, logs, and traces.
Why it stands out. The free tier is the largest here by far: 100,000 API test runs and 10,000 browser test runs a month. Scripted checks use k6, Grafana’s open-source load testing tool, so the same scripts can do double duty for load tests. Checks can feed service level objectives with burn-rate alerts.
What to know. You get the most out of it if you use Grafana for the rest of your observability; on its own, setup takes more work than an uptime-first tool. There are no hosted public status pages.
Pricing. Free: 100,000 API and 10,000 browser test runs a month. Pro: a $19 a month platform fee with the same allowance included, then from $5 per 10,000 API runs and $50 per 10,000 browser runs.
5. New Relic Synthetics: best free tier inside a full platform
What it is. New Relic Synthetics is part of New Relic’s observability platform, with ping, simple browser, scripted browser, step-based, and scripted API monitors, plus broken-link and certificate checks.
Why it stands out. The free tier includes 500 synthetic checks a month alongside 100 GB of data ingest and one full platform user, so a small team can try synthetic checks next to APM and logs at no cost. Step monitors let you build a journey without code, and scripted monitors cover the rest.
What to know. 500 checks a month is about one check every 90 minutes, so real coverage means paying per check. Pricing across New Relic’s users and data ingest takes some modelling.
Pricing. Free: 500 synthetic checks a month. Beyond that, $0.005 per check, plus the platform’s user and data charges.
6. Better Stack: best for uptime, on-call, and scripted checks together
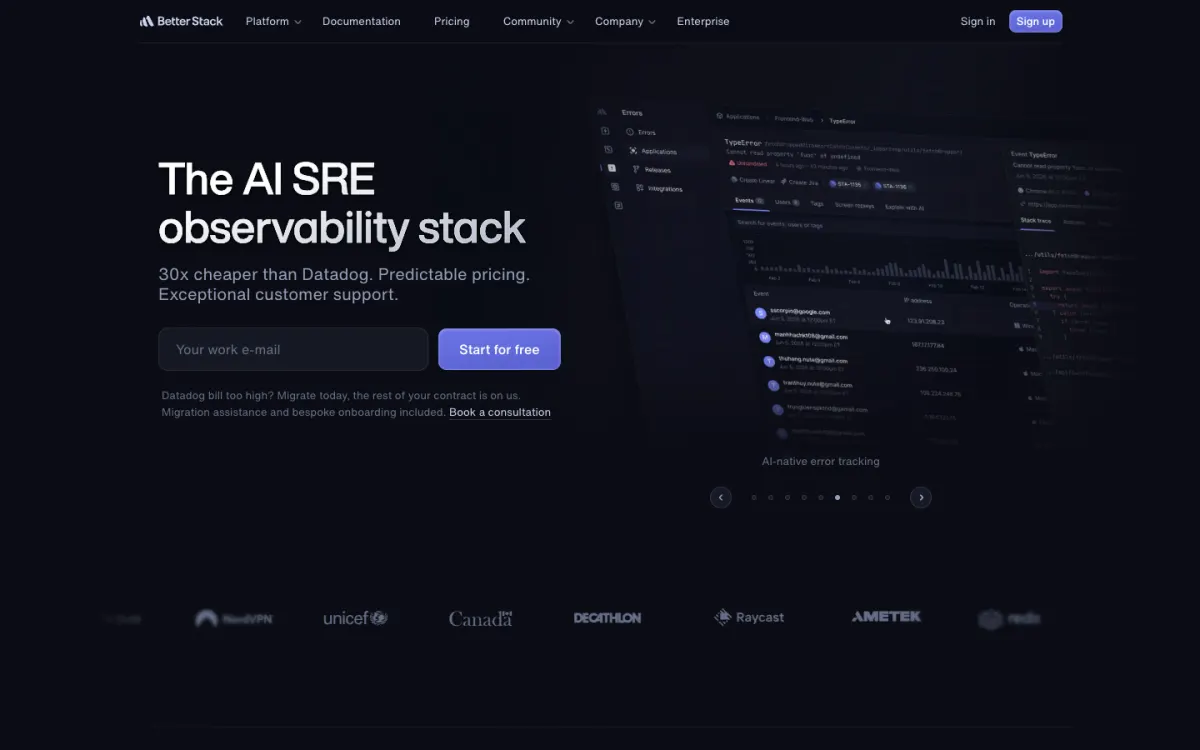
What it is. Better Stack combines uptime monitoring, incident management with on-call scheduling, status pages, and logs, metrics, and traces. Its Playwright monitors run your Playwright scripts as scheduled checks.
Why it stands out. One platform takes you from a failed Playwright scenario to a phone call to the on-call engineer and an update on the status page. Scripts can read secrets from environment variables, and runs can export data for later analysis.
What to know. Playwright monitors are billed by usage on top of seats, and the monthly bill is harder to predict than a flat plan. The free tier covers uptime monitors and heartbeats with 3-minute checks.
Pricing. Free: 10 monitors and 10 heartbeats. Responder seats $34/mo, or $29/mo billed yearly. Playwright usage is billed separately; check the pricing page for current rates.
7. Pingdom: best mature suite with a transaction recorder
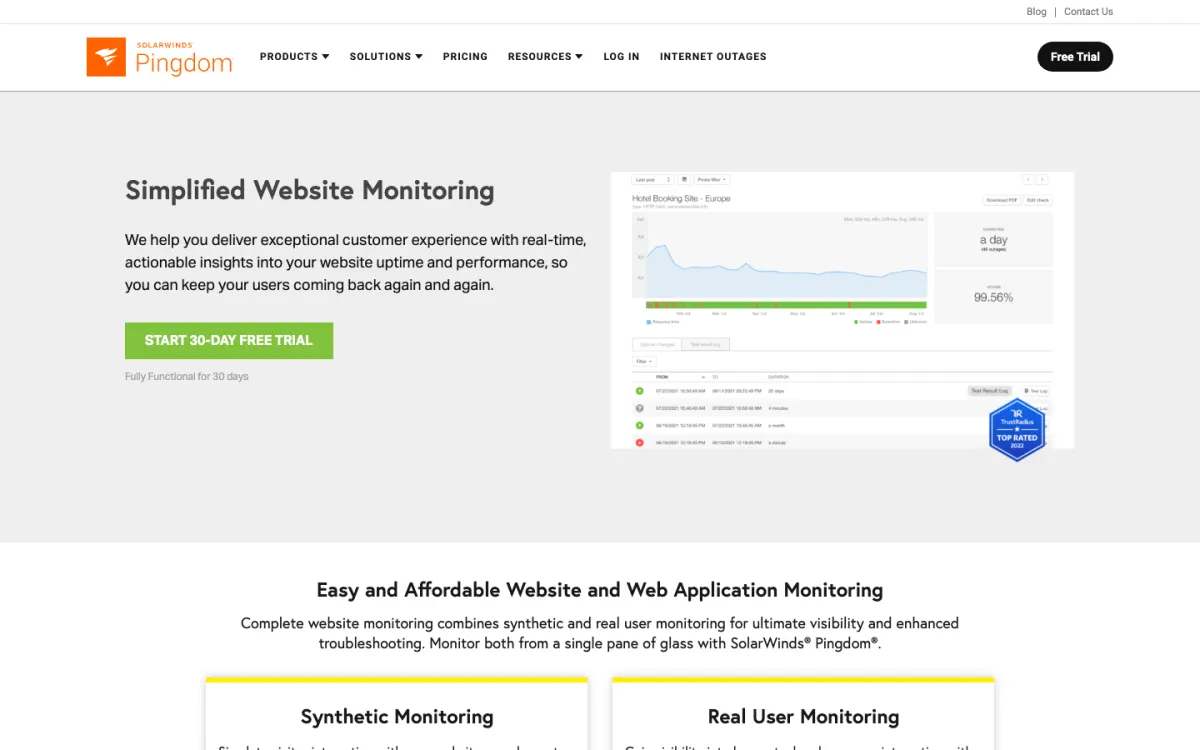
What it is. Pingdom, from SolarWinds, combines uptime checks, transaction monitoring, page speed analysis, and real-user monitoring, from more than 100 locations.
Why it stands out. Transaction checks are built with a recorder, so you can monitor a login or checkout without writing a script. It is a long-established product with strong incident-routing integrations, and synthetic and RUM sit in one account.
What to know. There is no free tier, only a 30-day trial. Synthetic and RUM are billed as separate products, the fastest interval is 1 minute, and the interface feels dated next to newer tools.
Pricing (shown in euros). Synthetic Monitoring with 10 uptime checks and 1 advanced check: €16/mo, or €14.33/mo billed yearly, scaling up with the number of checks.
8. Uptrends: most checkpoint locations
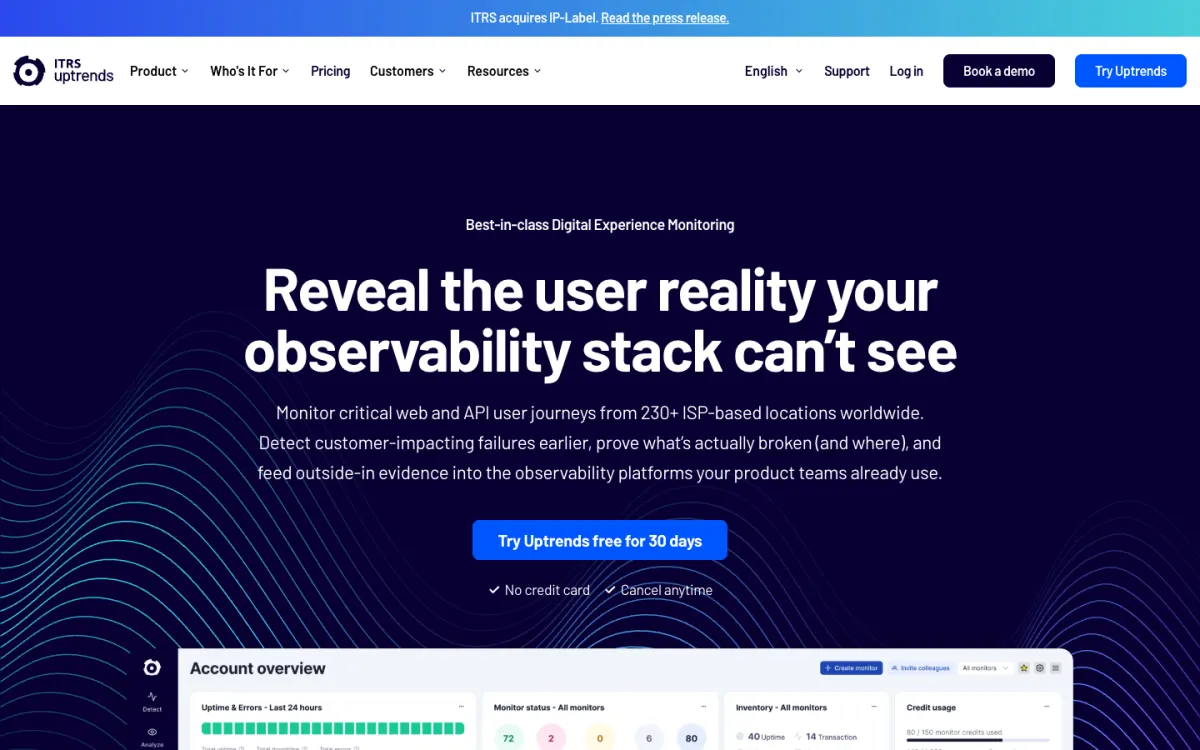
What it is. Uptrends monitors websites, APIs, and multistep user journeys from more than 230 checkpoint locations, with a transaction recorder and real-user monitoring.
Why it stands out. The checkpoint network is the largest here, which matters if you need to test from specific countries or cities. Transaction monitors are recorded in the browser and can be edited step by step, and the Enterprise plan adds checkpoints inside your firewall.
What to know. Transaction and API monitoring start on the Pro plan, not the cheaper Core plan. Transaction monitors run every 5 minutes on Pro, and usage is counted in credits, with each transaction step costing 50, so the number of journeys you can monitor depends on how long they are.
Pricing. Core $46/mo ($42 billed yearly) without transaction monitoring. Pro $66/mo ($60 yearly) with transaction and API monitoring. Enterprise custom. 30-day free trial with no card.
9. Site24x7: best low-cost full-stack platform
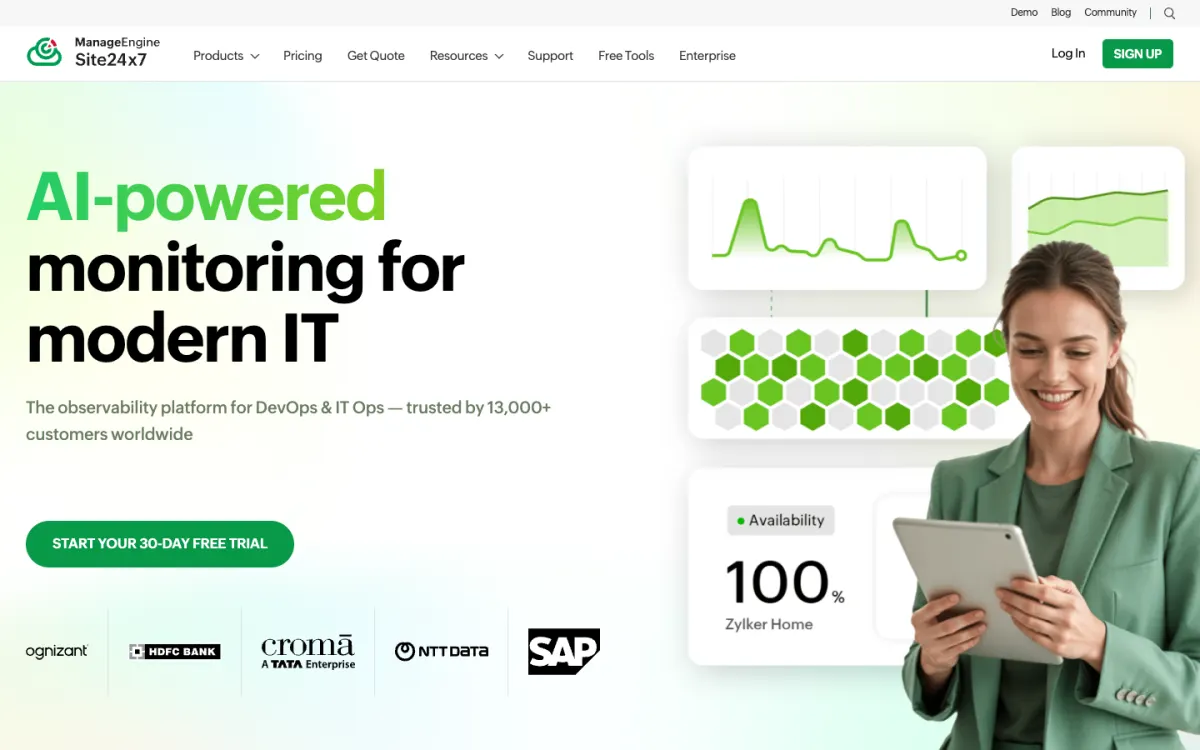
What it is. Site24x7, from ManageEngine, is an all-in-one monitoring platform covering websites, synthetic transactions, APIs, servers, APM, logs, and real-user monitoring, from more than 130 locations.
Why it stands out. It reaches from a simple uptime check to infrastructure and application monitoring at a low entry price, and its web transaction monitors are recorded in the browser. Status pages are bundled through StatusIQ.
What to know. The many product lines and add-ons make the true monthly cost hard to predict, and the interface is busier than focused tools. The free plan checks every 5 minutes from a single location.
Pricing. Free Forever: 50 website monitors. Web Uptime $10/mo, or $9/mo billed yearly. Web Perf $39/mo, or $36/mo billed yearly, for 40 sites from 8 locations.
10. Uptime.com: best for SLA reporting
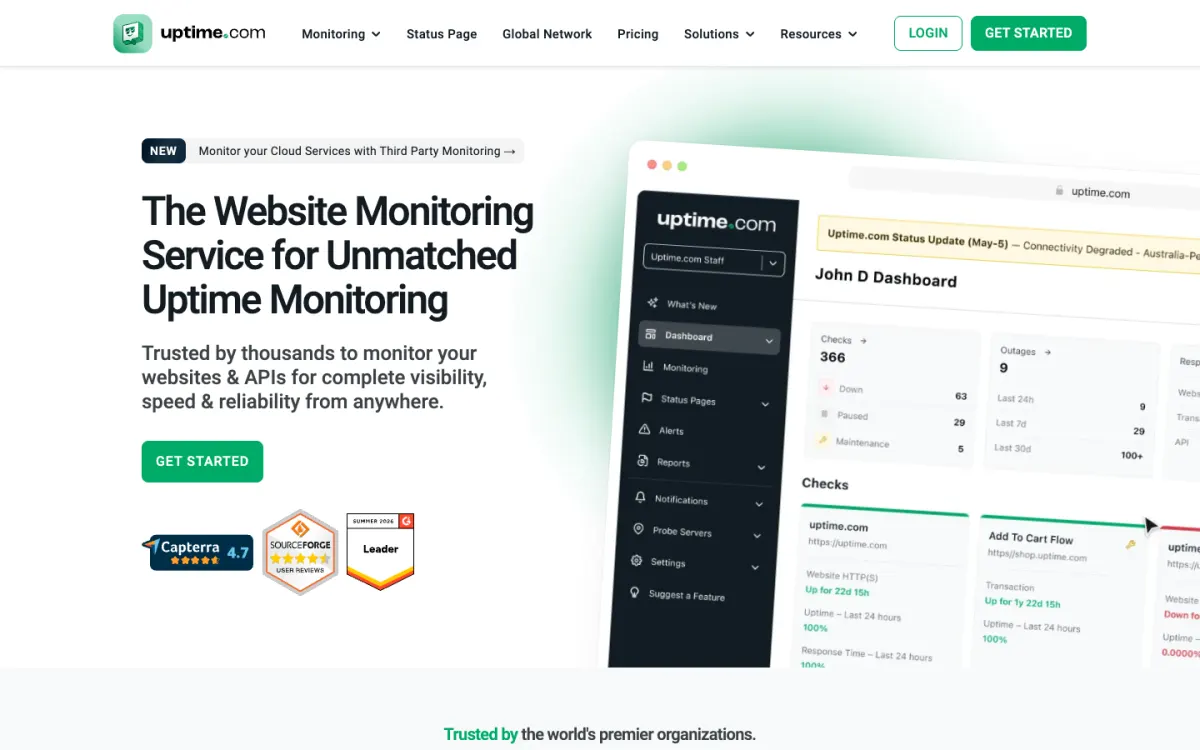
What it is. Uptime.com combines uptime, transaction, and API checks with real-user monitoring and public and private status pages.
Why it stands out. Transaction checks are built step by step without code, SLA reporting is strong, and private status pages with SSO suit internal teams. It is built to cut false positives with checks from multiple locations.
What to know. There is no free tier. Status pages, RUM, and extra locations are add-ons, so a full setup costs more than the entry price.
Pricing. From $9/mo or $84/yr for 10 basic checks and 1 advanced check, then $19/mo for 25 checks, $38 for 50, and $75 for 100. Status pages are $13/mo each.
Can you build synthetic monitoring yourself?
Yes, for a few critical journeys. A Playwright or k6 script run on a schedule by GitHub Actions, a cron job, or Grafana k6 OSS gives you a basic synthetic check for free. What you give up is what the tools above sell: running from many locations, retries to rule out network blips, alert routing, screenshots and traces of failures, and history to compare against. A common middle path is to write checks in Playwright and run them on Checkly or Better Stack, so the scripts stay portable.
How to choose a synthetic monitoring tool
- Your team writes Playwright tests and deploys from CI: Checkly.
- You want to know that key journeys work without writing scripts, along with uptime checks and a status page: Pulsetic.
- You already pay for Datadog: Datadog Synthetic Monitoring.
- You use Grafana and want the biggest free allowance: Grafana Cloud.
- You want synthetic checks next to APM on a free tier: New Relic.
- You want scripted checks, on-call, and status pages in one bill: Better Stack.
- You want a recorder and a long-established vendor: Pingdom.
- You need to test from many specific countries: Uptrends.
- You want full-stack monitoring at a low price: Site24x7.
- You report SLAs to customers: Uptime.com.
If you only need to know that your site is up, you may not need synthetic journeys at all yet; our guide to the best website monitoring tools covers uptime-first options, and status pages covers telling users when something breaks.
FAQ
What is synthetic monitoring?
Synthetic monitoring tests a website or API with simulated traffic on a schedule, instead of waiting for real users. A monitor runs a scripted check, such as loading a page, calling an endpoint, or logging in and checking out, from one or more locations, and alerts you when a step fails or slows down.
What are the best synthetic monitoring tools?
Checkly is the best synthetic monitoring tool for developers, with Playwright browser checks defined in code. Pulsetic is best for checking user journeys without writing code, with AI monitors that follow plain-English instructions alongside uptime checks and status pages. Datadog is best for teams already on Datadog, and Grafana Cloud has the most generous free allowance.
What is the difference between synthetic monitoring and real-user monitoring?
Synthetic monitoring runs scripted checks on a schedule from fixed locations, so it catches failures even when nobody is visiting and gives a consistent baseline. Real-user monitoring collects data from actual visitors’ browsers, so it shows real performance across devices and networks, but only for pages people visit. Most teams use both.
Is there a free synthetic monitoring tool?
Yes. Grafana Cloud includes 100,000 API and 10,000 browser test runs a month free, Checkly’s Hobby plan includes 1,000 browser runs a month, and New Relic includes 500 synthetic checks a month. You can also run Playwright or k6 scripts on a schedule yourself, without alert routing or multiple locations.
How much does synthetic monitoring cost?
Browser checks are usually billed per run: Datadog charges $12 per 1,000 browser runs billed yearly, and Grafana Cloud $50 per 10,000 beyond its free allowance. Plan-based tools start lower, such as Pulsetic at $9 a month or Checkly at $24 a month billed yearly. Running one check every minute from several locations means hundreds of thousands of runs a month, so frequency and location count drive the price.
How often should synthetic checks run?
Run API checks for critical endpoints every 1 to 5 minutes, and browser journeys such as login or checkout every 5 to 15 minutes. For less critical flows, hourly or a few times a day is enough. Running every check every minute from many locations multiplies cost without adding much.
What is the difference between synthetic monitoring and uptime monitoring?
Uptime monitoring is the simplest form of synthetic monitoring: it checks that a URL responds, often with a keyword check. Full synthetic monitoring adds multistep API calls and real browser journeys, so it catches problems such as a broken login or checkout that a simple uptime check can’t see.
Build your Bootstrap theme
Design a custom Bootstrap 5 theme visually with a live preview, then export clean Sass or CSS.
Open the Builder