Cron Job Monitoring: How It Works and the 8 Best Tools
Cron jobs fail quietly. A nightly backup stops running after a server move, an invoice script starts crashing on a bad record, a cleanup task hangs forever, and nobody notices until the backup is needed or a customer complains. Uptime monitoring can’t catch this, because nothing is down: the job simply never ran. Cron job monitoring, also called heartbeat monitoring, turns the check around. Your job reports in each time it finishes, and you get an alert when a report doesn’t arrive on time.
This guide explains how heartbeat monitoring works, why cron jobs fail silently, how to add a check-in to a crontab line, GitHub Actions, or a Kubernetes CronJob, and compares eight tools, most with free plans.
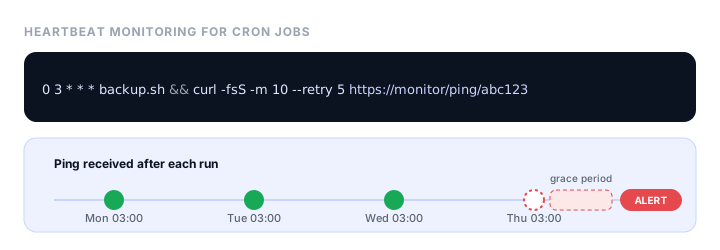
How cron job monitoring works
A heartbeat monitor is a dead man’s switch:
- The monitor gives you a unique URL and you tell it how often to expect a ping, for example every 24 hours, plus a grace period, say 30 minutes.
- Your job requests that URL when it succeeds, usually with one
curlcommand at the end. - If no ping arrives within the interval plus the grace period, the monitor marks the job as down and alerts you by email, Slack, SMS, or whatever channels you set up.
This catches every way a job can fail to finish: the cron daemon stopped, the server was replaced, the job crashed, the job hung, or the schedule was deleted. More advanced tools also accept a “start” ping, so they can measure how long each run takes and alert when a job runs too long, and a “fail” ping, so a job can report an error right away instead of waiting for the deadline.
Why cron jobs fail silently
Most cron failures produce no error anyone sees:
- A different environment. Cron runs jobs with a minimal environment:
/bin/shas the shell and a shortPATH, without the variables your login shell loads. A script that works in your terminal fails under cron because it can’t find a command or a credential. Use full paths, and set variables at the top of the crontab. - Mail goes nowhere. Cron emails a job’s output to the crontab’s owner, or to the
MAILTOaddress. On most modern servers no mail system is configured, so error output disappears. - The server changed. Moving to a new server or container image, rebuilding an instance, or restarting a container often loses the crontab entirely.
- Time zones and daylight saving time. Cron uses the server’s time zone. When clocks change, a job scheduled in the skipped hour doesn’t run, and a job in the repeated hour can run twice.
- Overlapping runs. If a job takes longer than its interval, the next run starts on top of it. Wrap jobs that must not overlap with
flock -n /tmp/job.lock, which skips a run while the previous one holds the lock. - The job hangs. A network call with no timeout can wait forever, so the job never fails and never finishes.
- A
%in the command. In a crontab line, an unescaped%turns into a newline, which quietly breaks commands such asdate +%F. Escape it as\%.
Add a heartbeat to a cron job
The standard pattern pings only when the job succeeds:
0 3 * * * /usr/local/bin/backup.sh && curl -fsS -m 10 --retry 5 -o /dev/null https://hc-ping.com/your-check-id
&&runscurlonly ifbackup.shexits with status 0, so a failed backup never sends the “all good” ping.-fsSfails on HTTP errors and stays quiet unless something goes wrong.-m 10gives up after 10 seconds, so a slow monitoring service can’t hang your job.--retry 5retries on timeouts and server errors.-o /dev/nulldiscards the response body.
Replace the URL with the one your monitoring tool gives you. The same pattern works for any tool that accepts a simple ping.
Report failures and run time
Tools that support start and fail signals give you more. With Healthchecks.io, for example:
#!/bin/bash
set -o pipefail
URL=https://hc-ping.com/your-check-id

curl -fsS -m 10 --retry 5 -o /dev/null "$URL/start"   # job started
/usr/local/bin/backup.sh
curl -fsS -m 10 --retry 5 -o /dev/null "$URL/$?"      # 0 = success, anything else = failure
The start ping lets the tool measure each run’s duration and spot a job that started but never finished. Sending the exit status ($?) reports failures straight away. set -o pipefail makes a pipeline fail if any command in it fails, not just the last one.
GitHub Actions scheduled workflows
GitHub runs scheduled workflows on a best-effort basis. Its documentation warns that the schedule event “can be delayed during periods of high loads”, especially at the start of every hour, that some queued jobs may be dropped under very high load, and that in public repositories scheduled workflows are disabled after 60 days without repository activity. A heartbeat tells you when any of that happens:
on:
  schedule:
    - cron: "17 3 * * *"   # avoid minute 0, the busiest time

jobs:
  nightly:
    runs-on: ubuntu-latest
    steps:
      - uses: actions/checkout@v4
      - run: ./scripts/nightly.sh
      - name: Ping heartbeat
        if: success()
        run: curl -fsS -m 10 --retry 5 -o /dev/null "${{ secrets.HEARTBEAT_URL }}"
Store the ping URL as a repository secret so it isn’t public.
Kubernetes CronJobs
Kubernetes has no built-in check-in, so add the ping to the container’s command, with the URL from a Secret:
apiVersion: batch/v1
kind: CronJob
metadata:
  name: nightly-report
spec:
  schedule: "0 3 * * *"
  timeZone: "Europe/London"
  concurrencyPolicy: Forbid
  jobTemplate:
    spec:
      template:
        spec:
          restartPolicy: OnFailure
          containers:
            - name: report
              image: registry.example.com/report:1.4
              command: ["/bin/sh", "-c", "/app/report && curl -fsS -m 10 --retry 5 -o /dev/null \"$HEARTBEAT_URL\""]
              env:
                - name: HEARTBEAT_URL
                  valueFrom:
                    secretKeyRef: { name: heartbeat, key: url }
timeZone (stable since Kubernetes 1.27) sets the schedule’s time zone, and concurrencyPolicy: Forbid skips a run while the previous one is still going. The Kubernetes docs also note that a CronJob can occasionally create two Jobs or none for one schedule, so jobs should be safe to run twice.
The best cron job monitoring tools
| Tool | Free plan | Paid from | Start and fail signals | Run time | Open source |
|---|---|---|---|---|---|
| Pulsetic | 10 monitors, heartbeats included | $9/mo | Success ping only | No | No |
| Healthchecks.io | 20 checks | $5/mo | Yes, plus exit codes and logs | Yes | Yes, self-hostable |
| Cronitor | 5 monitors | $2 per monitor + $5 per user | Yes | Yes | No |
| Better Stack | 10 monitors and heartbeats combined | $29/mo per seat | Fail signal | No | No |
| Sentry Crons | 1 monitor | $0.78 per extra monitor | Yes | Yes, with max runtime | No |
| UptimeRobot | Paid plans only | €9/mo | Success ping only | No | No |
| Dead Man’s Snitch | 1 snitch | $5/mo | Error notices on top plan | No | No |
| Uptime Kuma | Free, self-hosted | $0 | Up or down status | No | Yes |
Prices are the lowest paid plans as listed in November 2026, billed annually where there’s a choice.
1. Pulsetic: best for uptime and cron in one place
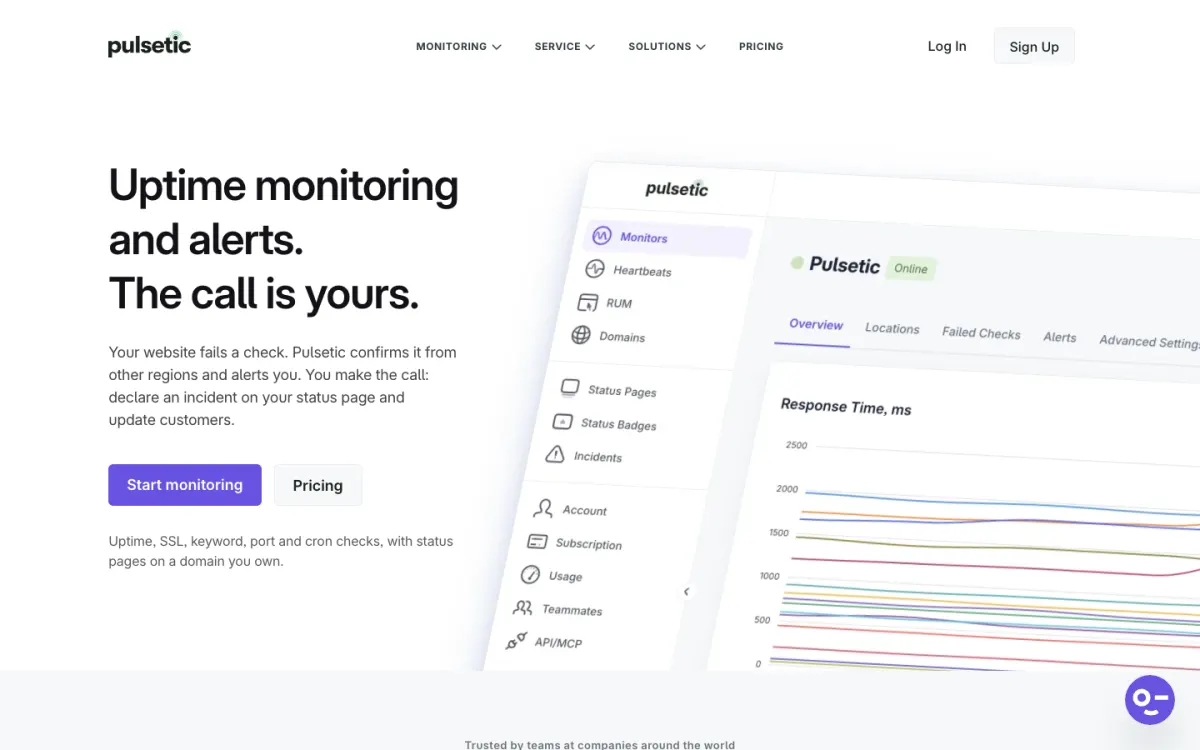
Pulsetic includes heartbeat monitors alongside its website, SSL, domain, and DNS monitoring and status pages, so one account watches both your site and the jobs behind it. Each heartbeat gets a unique URL that accepts GET or POST; you set the expected interval and a grace period, and Pulsetic alerts you when a ping is missed. Heartbeats share the plan’s monitor limit, so the free plan’s 10 monitors can be any mix of websites, heartbeats, and domains.
Alerts go by email and webhook on the free plan, and by SMS, phone call, WhatsApp, Slack, Teams, Discord, and Telegram from Solo. Heartbeat incidents can appear on your status page next to your website checks.
The catch. Pulsetic heartbeats accept a success ping only: there’s no start or fail signal and no run-time tracking, so a failing job is reported when its deadline passes rather than the moment it fails. For jobs where you need run times or captured output, pair it with a dedicated cron monitor.
Pricing. Free (10 monitors, heartbeats included); Solo $9/mo; Team $19/mo (50 monitors); Organization $49/mo (300 monitors). Extra monitors are $0.20 each.
2. Healthchecks.io: best dedicated cron monitor
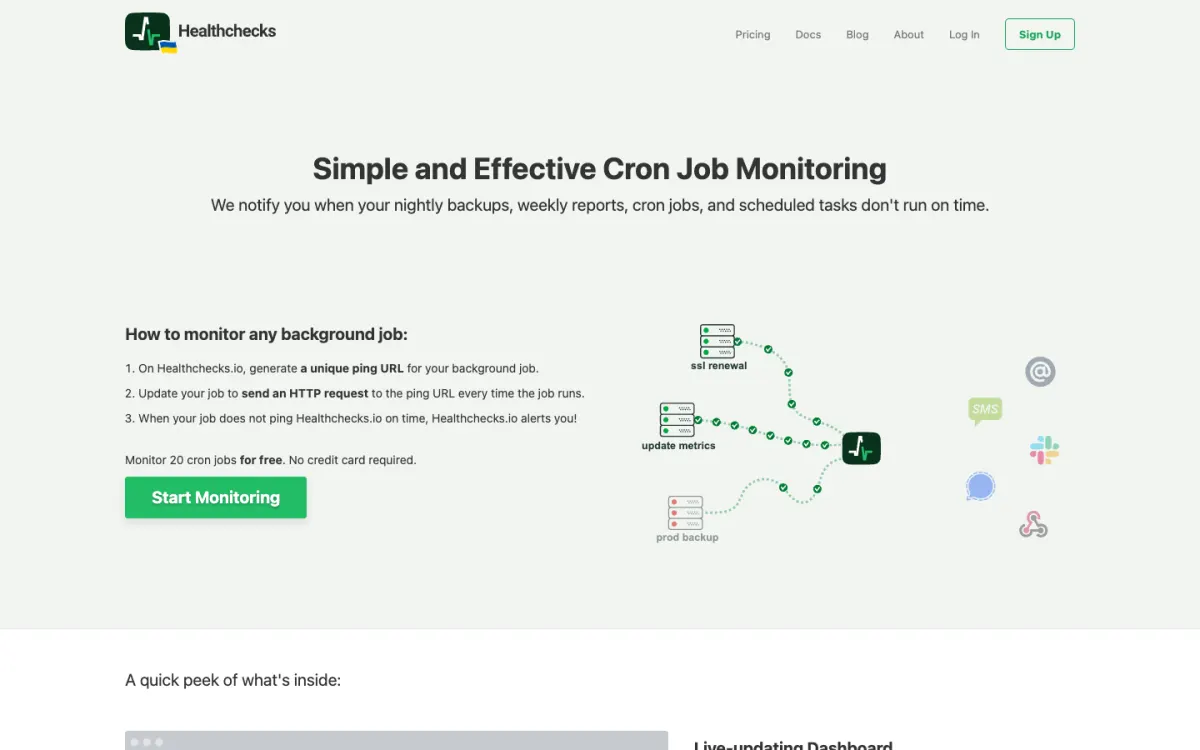
Healthchecks.io does one job very well. Checks run on a simple interval, a cron expression with its own time zone, or a systemd OnCalendar schedule. Jobs can send start, success, fail, and exit-code signals, and a POST body up to 100 KB is stored with each ping, so you can see the output of the run that failed. Run times are measured from the start ping. It’s open source (BSD license), so you can self-host it.
The catch. It monitors jobs only, not websites, and the interface is functional rather than pretty.
Pricing. Hobbyist free (20 checks); Supporter $5/mo; Business $20/mo (100 checks, SMS, WhatsApp, and phone alerts); Business Plus $80/mo (1,000 checks).
3. Cronitor: best for teams with many jobs
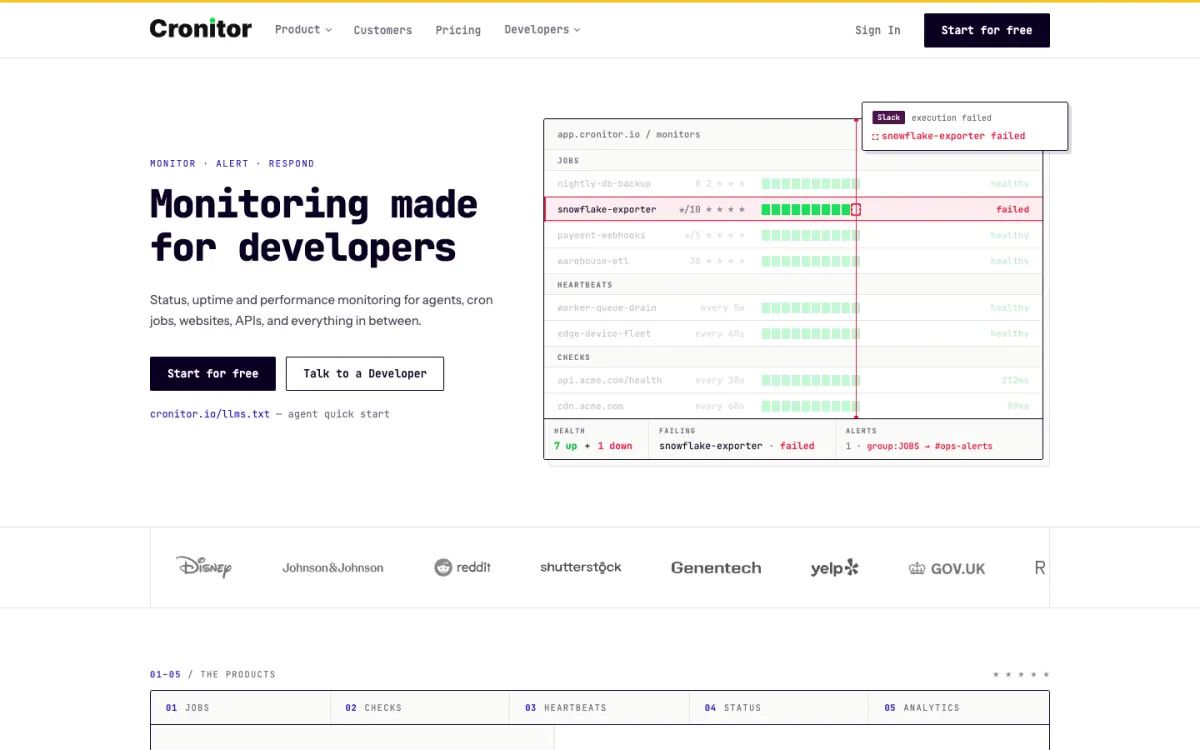
Cronitor tracks each run’s start, completion, failure, duration, and a short message, and can sync your crontab automatically with its CLI, so new jobs get monitored without setting each one up by hand. It also offers uptime checks and status pages.
The catch. Per-monitor and per-user pricing adds up for large teams, and the free plan covers only 5 monitors.
Pricing. Hacker free (5 monitors, 1 user); Business $2 per monitor plus $5 per user a month, with a 14-day trial.
4. Better Stack: best with on-call scheduling
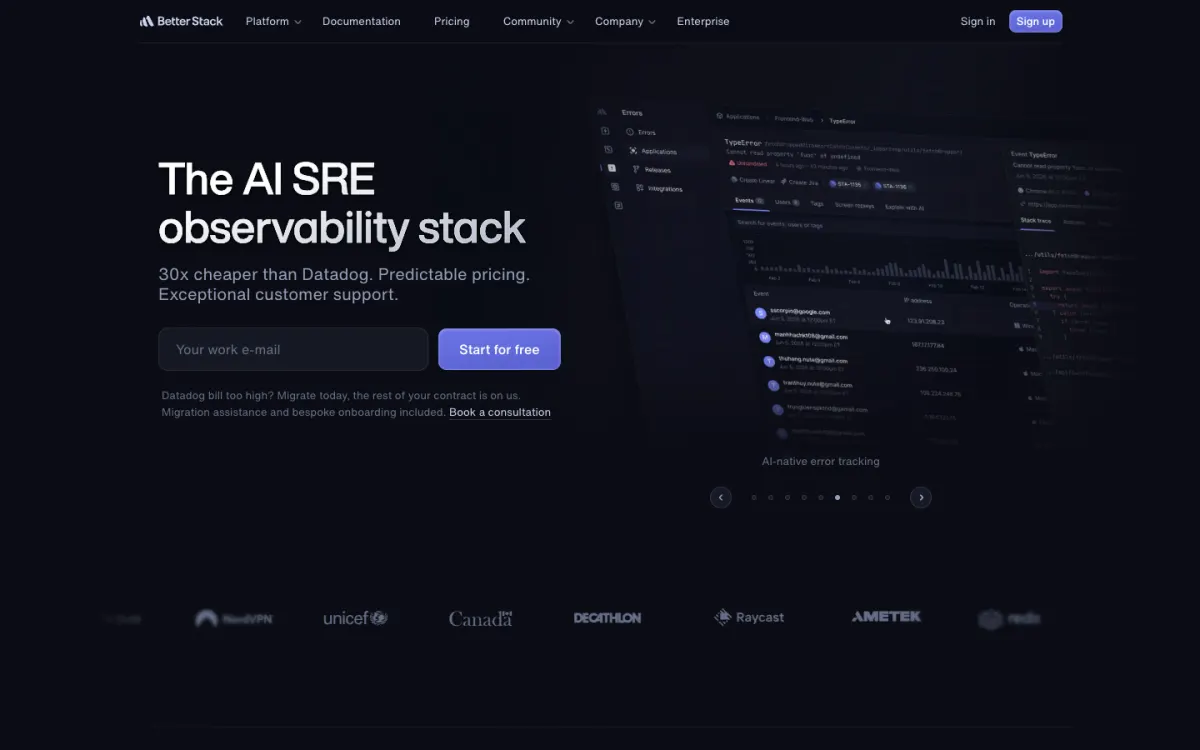
Better Stack includes heartbeats with its uptime monitoring, on-call schedules, and logs. Jobs can report failures to a /fail endpoint with an exit code and output, and alerts can escalate to phone calls through on-call rotations.
The catch. Seat-based pricing is expensive for a handful of cron jobs, and extra heartbeats cost $17 a month per 10 on annual billing.
Pricing. Free (10 monitors and heartbeats combined); Responder seats $29/mo annual.
5. Sentry Crons: best if you already use Sentry
Sentry Crons adds check-ins to Sentry’s error tracking, so a failed job’s check-in links to the exception that caused it. It knows the schedule (a crontab expression with a time zone), so it reports missed runs, failures, and runs longer than a maximum runtime you set.
The catch. It only makes sense if your code already reports to Sentry, and each extra monitor costs $0.78 a month from your pay-as-you-go budget.
Pricing. One monitor included on every Sentry plan; $0.78 per extra monitor on Team and Business.
6. UptimeRobot: cron monitoring on paid plans
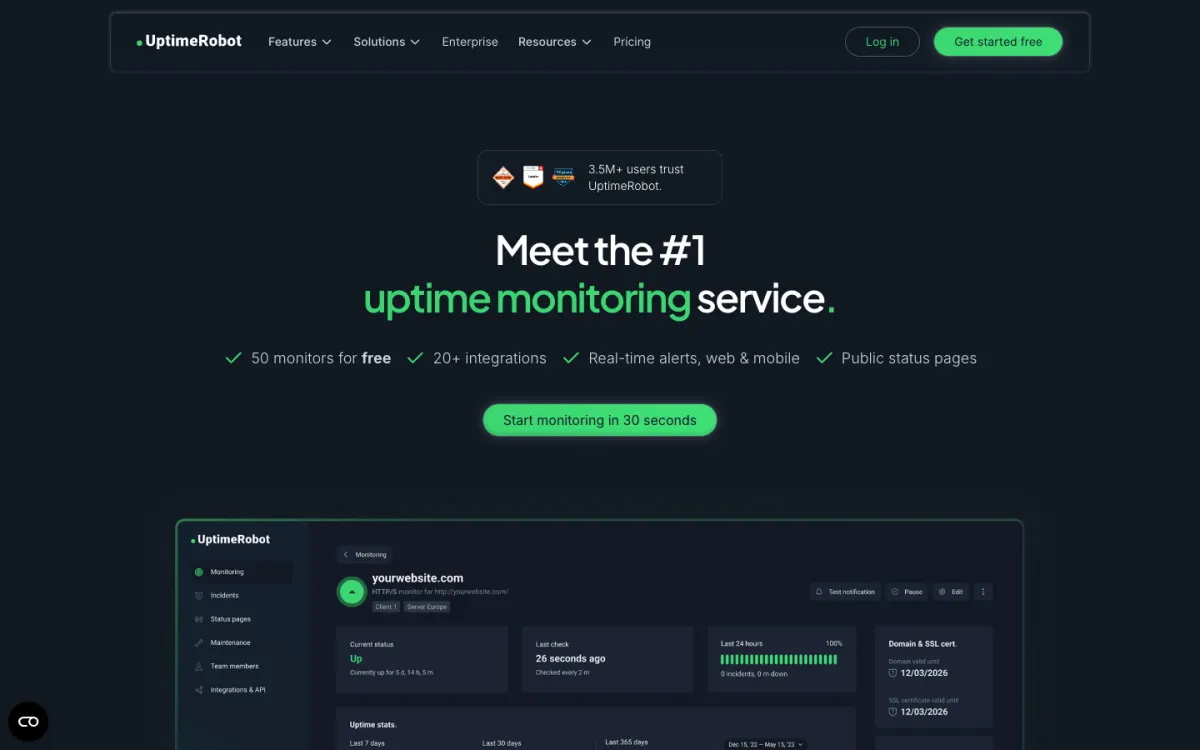
UptimeRobot includes heartbeat monitors on every paid plan, with intervals from 1 minute to 31 days, next to its website checks.
The catch. Heartbeats aren’t on the free plan, and like Pulsetic it accepts a success ping only.
Pricing. From Solo, €9/mo billed annually.
7. Dead Man’s Snitch: the simplest option
Dead Man’s Snitch is a long-running, single-purpose service: create a “snitch”, ping it from your job, and get an alert when it goes quiet. Its Field Agent wraps a command to report its exit status and output.
The catch. The free plan covers one job, and smart alerts and error notices are on the top plan only.
Pricing. The Lone Snitch free (1 snitch); Little Birdy $5/mo (3); Private Eye $19/mo (100); Surveillance Van $49/mo (300).
8. Uptime Kuma: best free self-hosted option
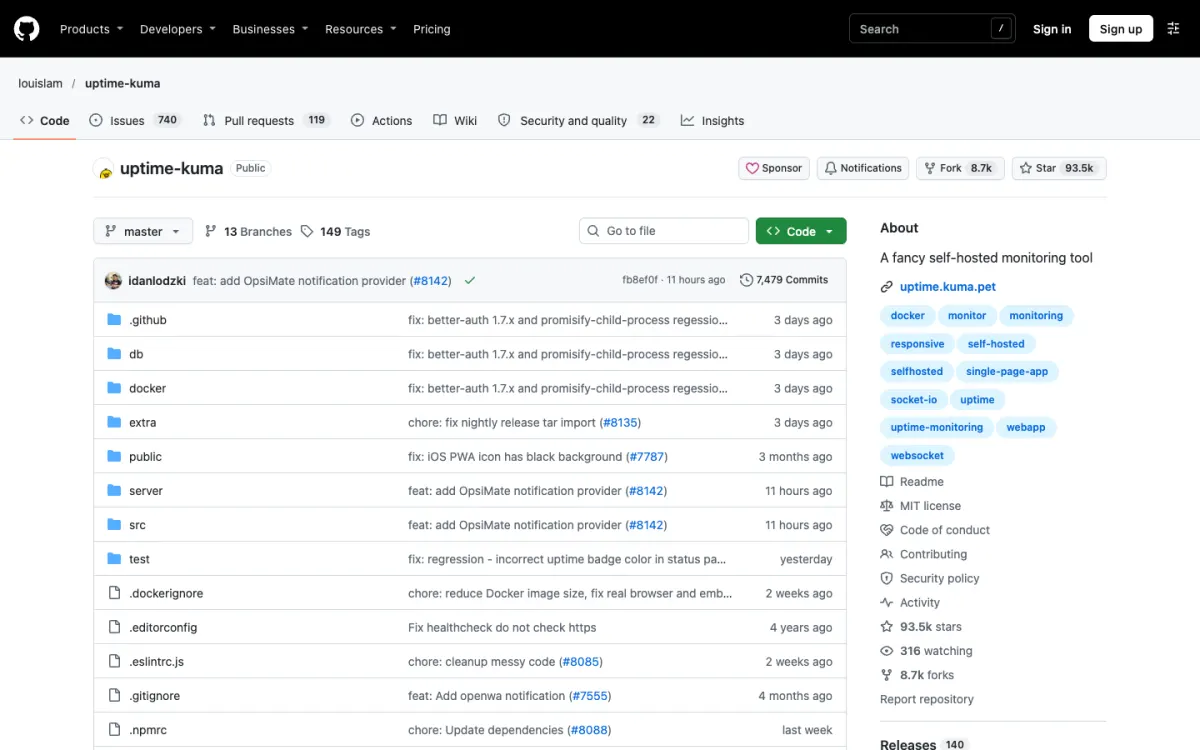
Uptime Kuma’s “Push” monitor type is a heartbeat: your job requests https://your-kuma-server/api/push/<token>?status=up&msg=OK, and Uptime Kuma alerts you through any of its 90+ notification services when pushes stop.
The catch. You run the server yourself, and it must not live on the same machine as the jobs it watches, or one outage silences both.
Pricing. Free (MIT license).
Cronhub, once a popular choice, shut down in 2026, so move any remaining Cronhub checks to one of the tools above.
How to choose
- You also need website and SSL monitoring: Pulsetic, so jobs and sites share one dashboard and status page.
- You want the most detail per job for free: Healthchecks.io, with start and fail signals, run times, and output on the free plan.
- You run dozens of jobs across servers: Cronitor, which can discover jobs from your crontabs.
- Your errors already go to Sentry: Sentry Crons.
- You need on-call escalation: Better Stack.
- You self-host everything: Uptime Kuma or self-hosted Healthchecks, on a separate server.
For website checks alongside your jobs, see our roundup of the best website monitoring tools.
Set up cron monitoring in 10 minutes
- List your scheduled jobs:
crontab -lfor each user,/etc/cron.d/, systemd timers (systemctl list-timers), CI schedules, and Kubernetes CronJobs. - Start with the jobs that hurt most when they stop: backups, billing, data syncs, certificate renewals, and email queues.
- Create a heartbeat for each with an interval matching the schedule and a grace period longer than the job’s normal run time.
- Add the ping to the end of each job with
&&, as shown above. - Test it. Run the job once and confirm the check turns green, then make it fail on purpose and confirm the alert arrives.
FAQ
What is cron job monitoring?
Cron job monitoring checks that scheduled jobs actually run. Each job requests a unique URL when it finishes, and the monitoring service alerts you when a request doesn’t arrive within the expected interval plus a grace period. It’s also called heartbeat monitoring or a dead man’s switch.
How do I know if my cron job failed?
Add a heartbeat ping to the job: your-command && curl -fsS -m 10 --retry 5 -o /dev/null <ping-url>. The ping runs only when the command succeeds, so a failed or missing run triggers an alert. Locally, check grep CRON /var/log/syslog or journalctl -u cron to see whether cron started the job.
Is there a free cron job monitoring tool?
Yes. Healthchecks.io monitors 20 jobs free, Pulsetic includes heartbeats in its free plan’s 10 monitors, Better Stack’s free plan covers 10 monitors and heartbeats combined, Cronitor monitors 5 jobs free, and Uptime Kuma and Healthchecks can be self-hosted for free.
Why does my cron job work manually but not in cron?
Cron runs jobs with a minimal environment: /bin/sh, a short PATH, and none of the variables your shell profile sets. Use full paths to commands and files, set needed variables in the crontab or script, and escape any % characters in the crontab line.
What is a heartbeat monitor?
A heartbeat monitor waits for regular pings from a job, server, or device, and alerts you when they stop. It’s the reverse of an uptime check: instead of the monitor checking your service, your service checks in with the monitor.
Build your Bootstrap theme
Design a custom Bootstrap 5 theme visually with a live preview, then export clean Sass or CSS.
Open the Builder